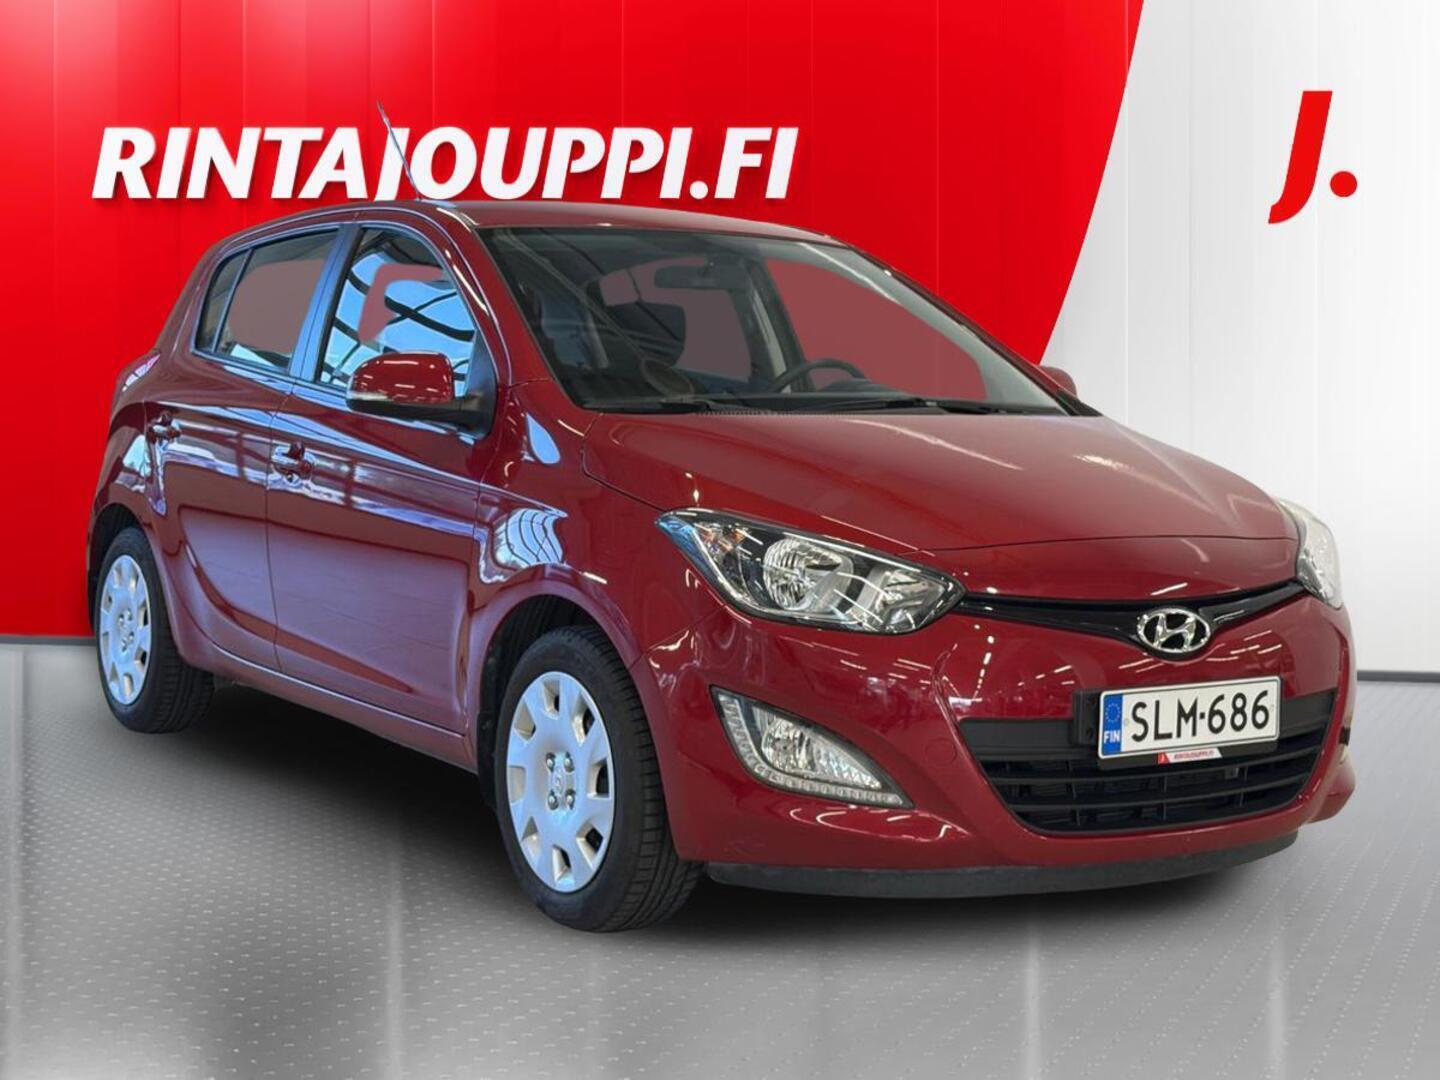
On sale 127 daysOn sale 127 d
9,299 €
J. Rinta-Jouppi Lappeenranta, Etelä-Karjala

Used cars, models and price levels
#12 most popular make in Finland (of 93 makes)*
*measured by number of active listings
Hyundai is Finland's #12 most popular car make: 1,098 cars are for sale, which is 1.8 % of all cars for sale in Finland. The median asking price is 18,400 € and the average is 20,718 €; the cheapest car costs 20 € and the priciest 87,045 €. The most popular models are i20, i30 and Tucson. The most common fuel type is petrol (49% of cars for sale) and the most common body type is hatchback (41%). Average mileage is 99,179 km. Median time on market is 17 days. The inspection failure rate averaged 25.7 % in 2025 periodic inspections.
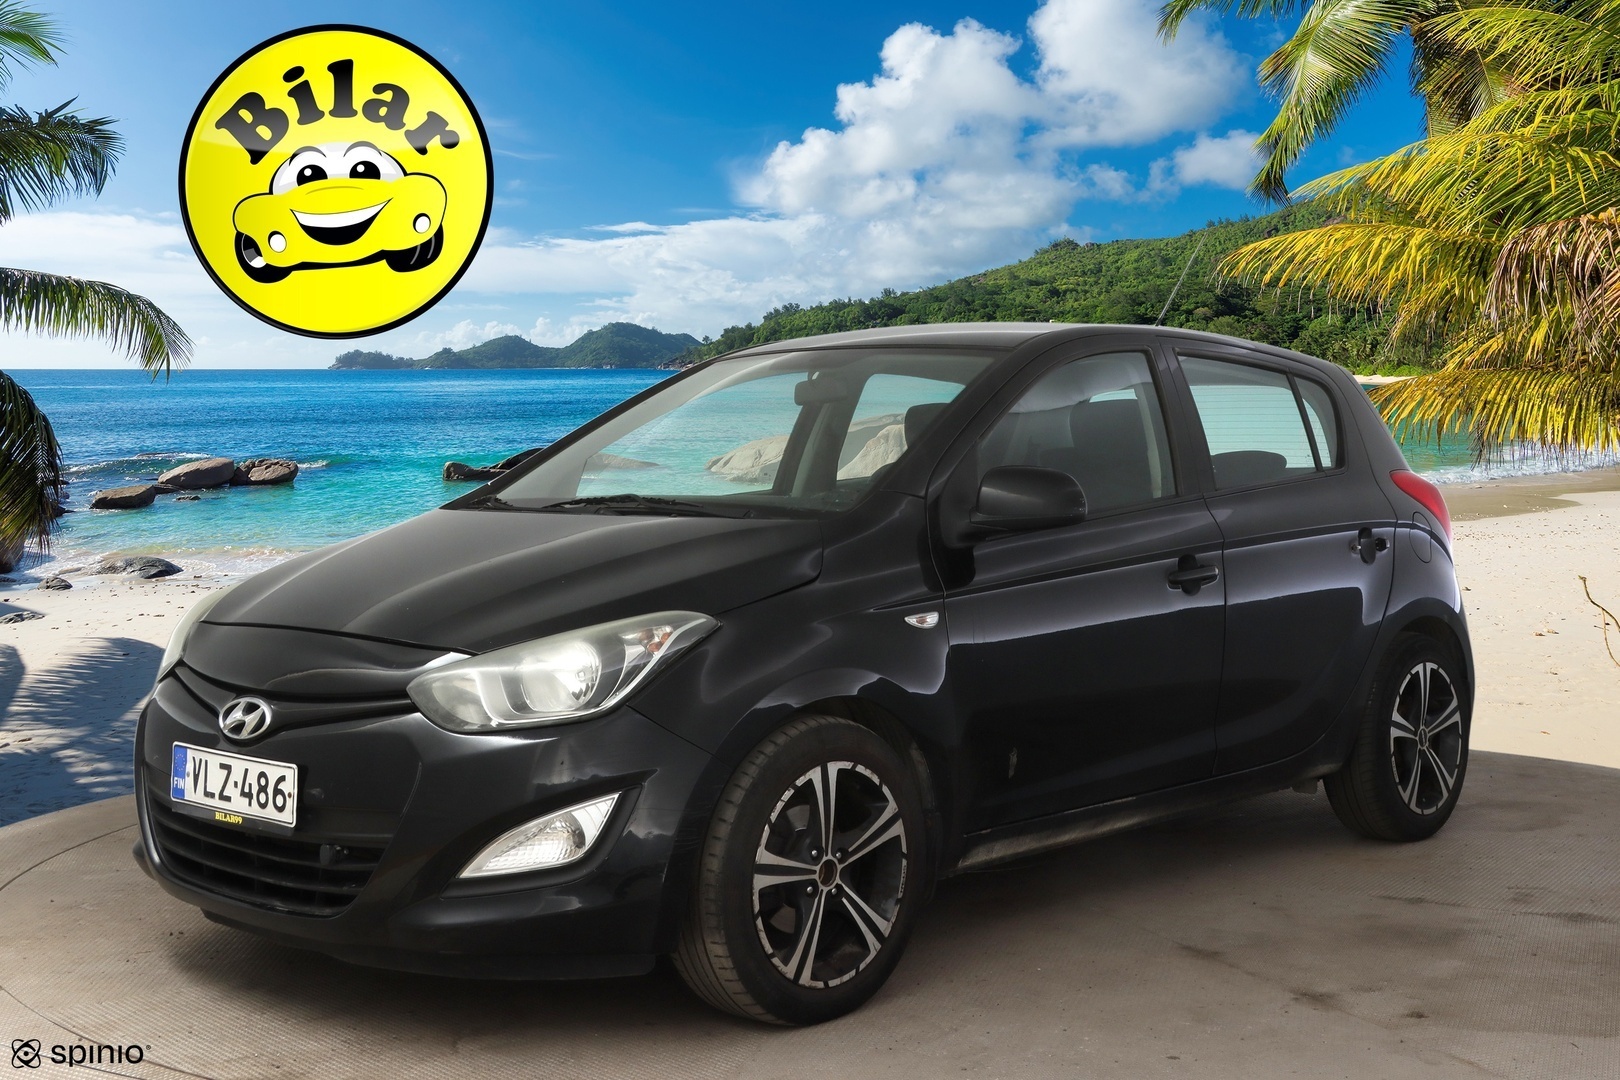 1 / 8
i20
198 for sale · 731 sold
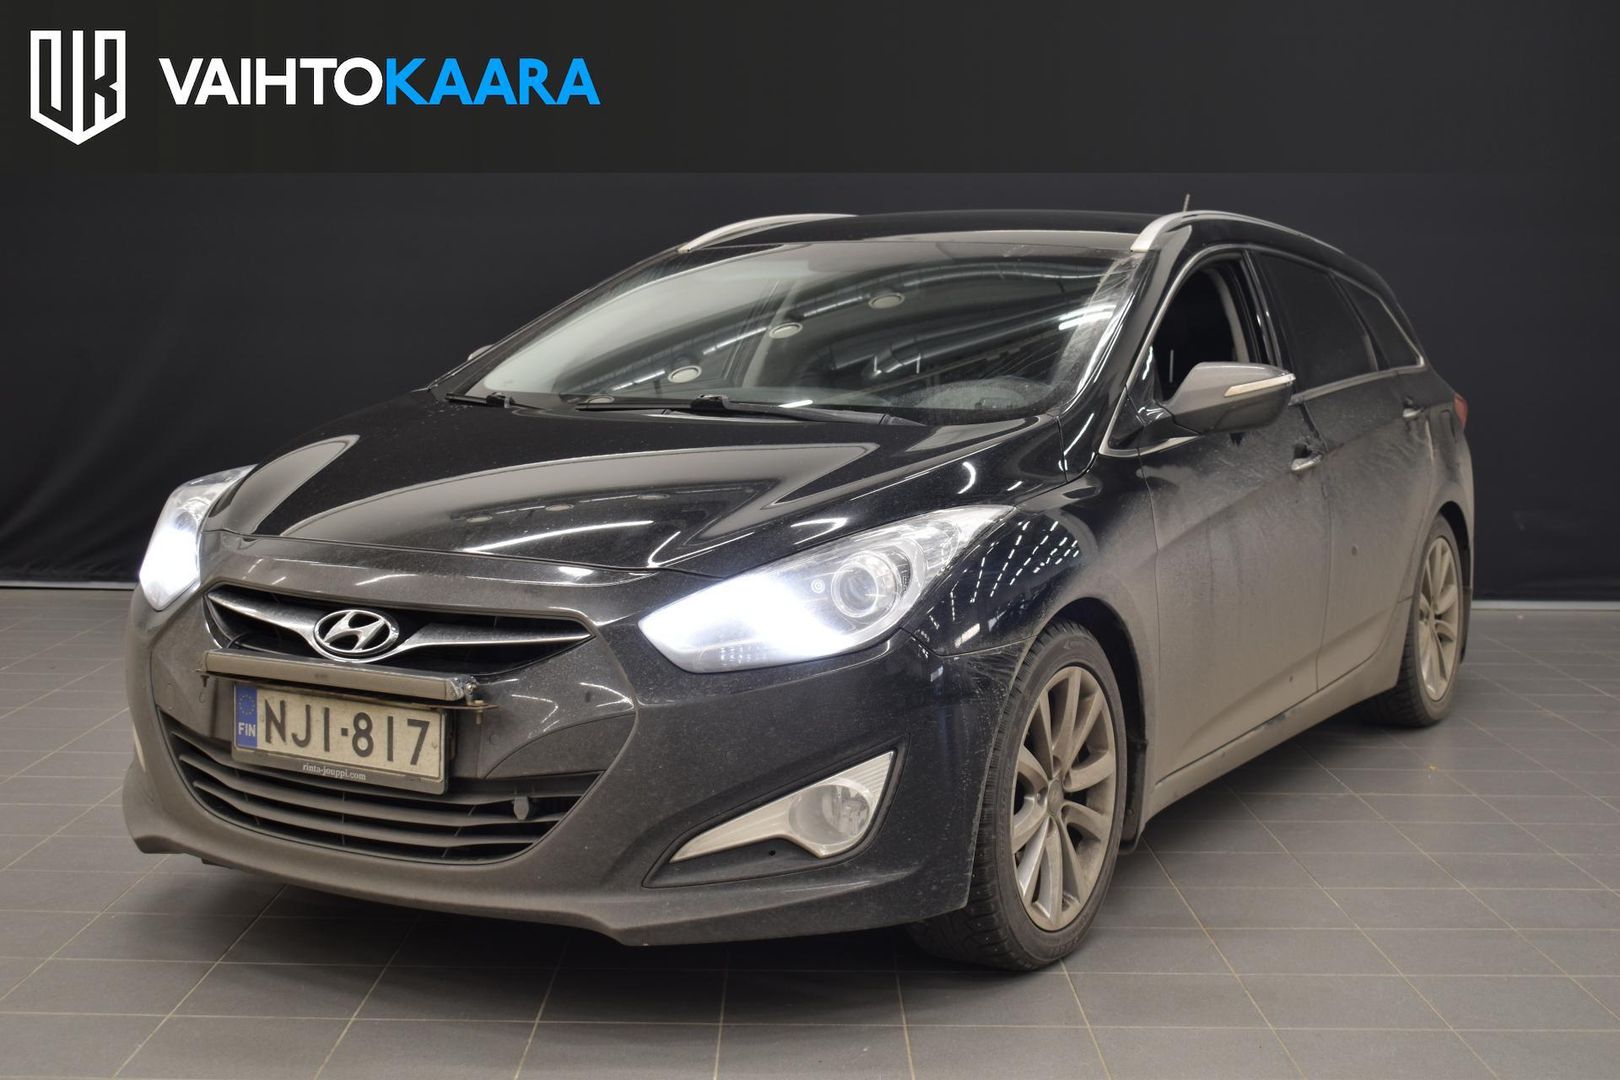 1 / 8
i40
27 for sale · 150 sold
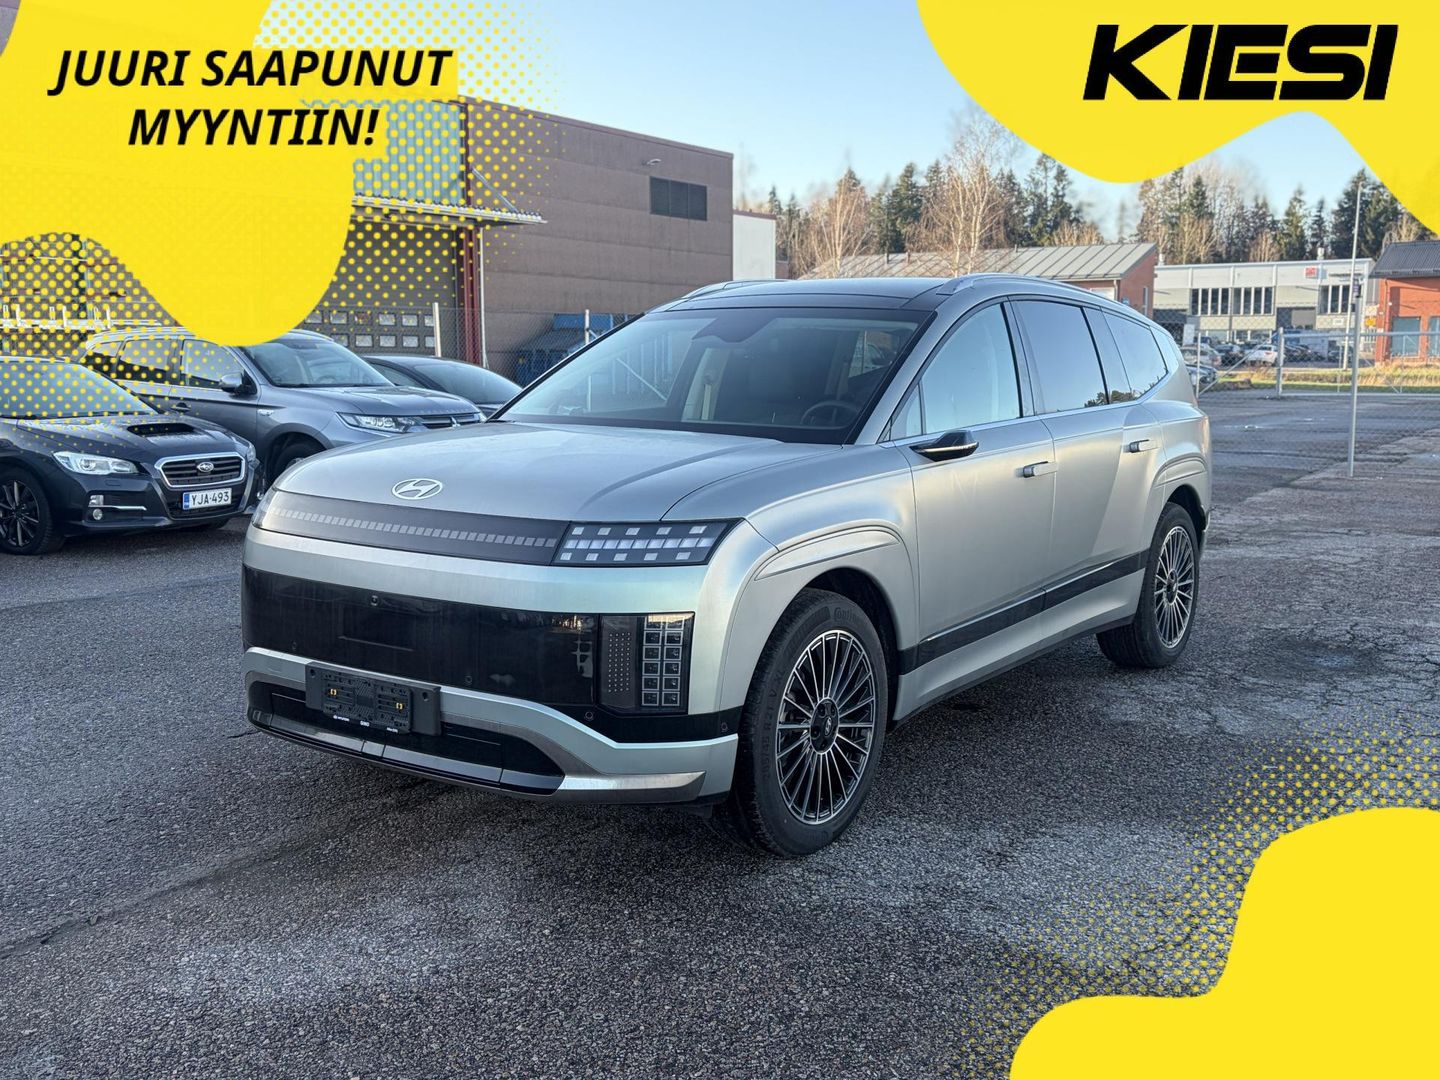 1 / 8
Ioniq 9
9 for sale · 19 sold
1 / 8 i20
198 for sale · 731 sold
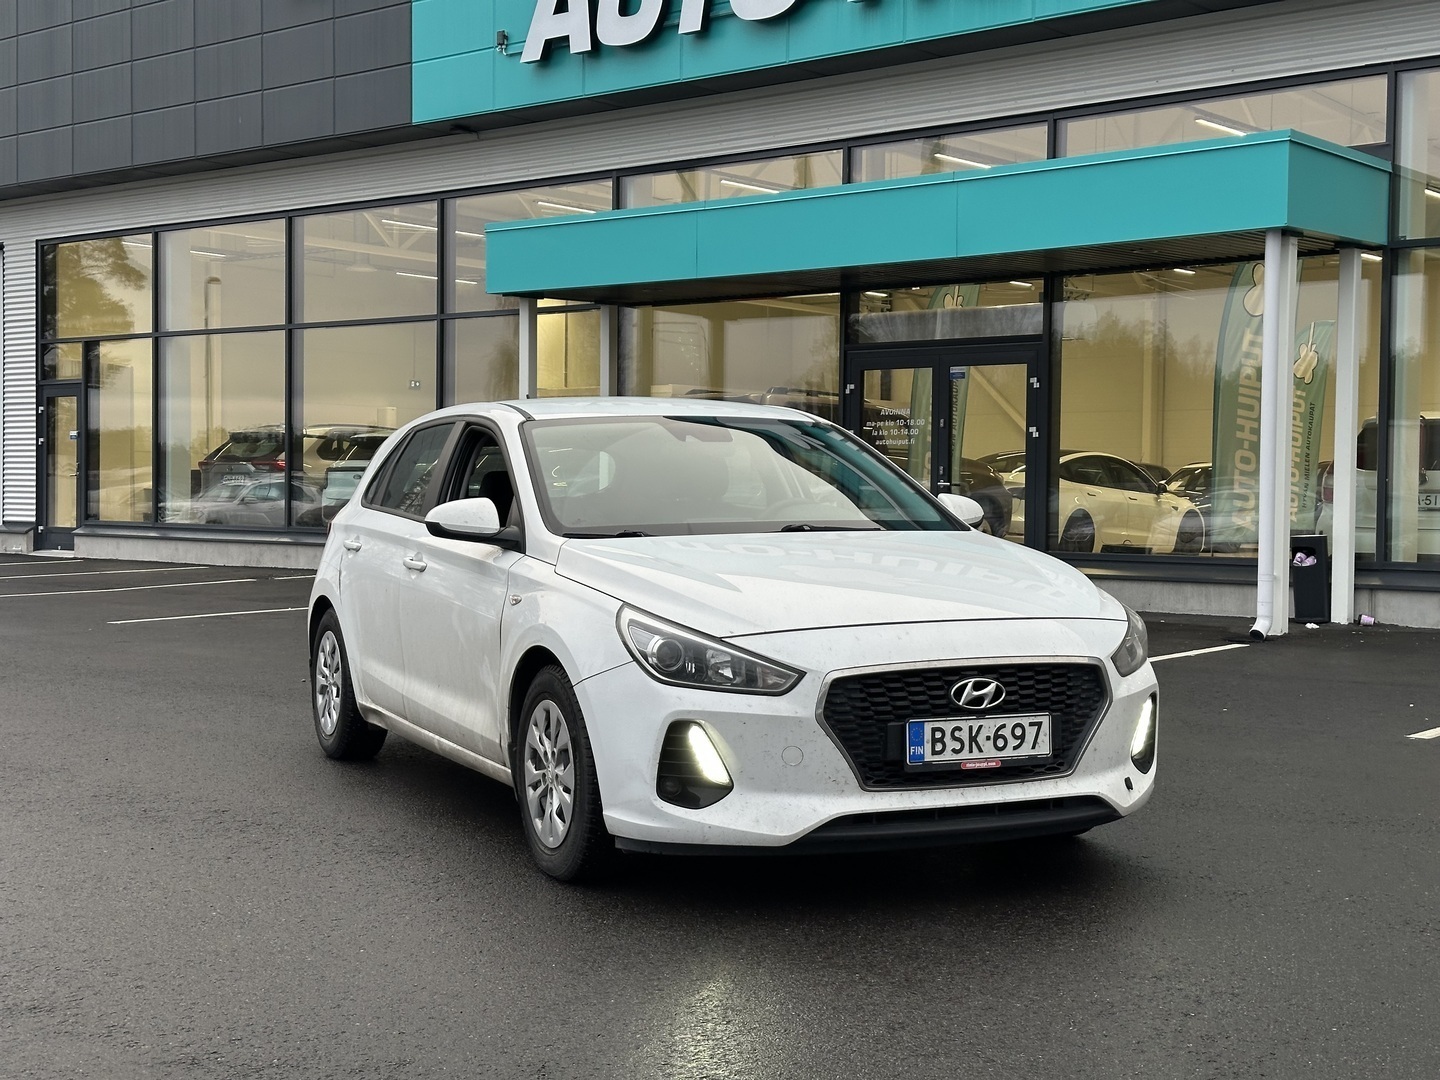 1 / 8
i30
172 for sale · 748 sold
 1 / 8
Tucson
134 for sale · 327 sold
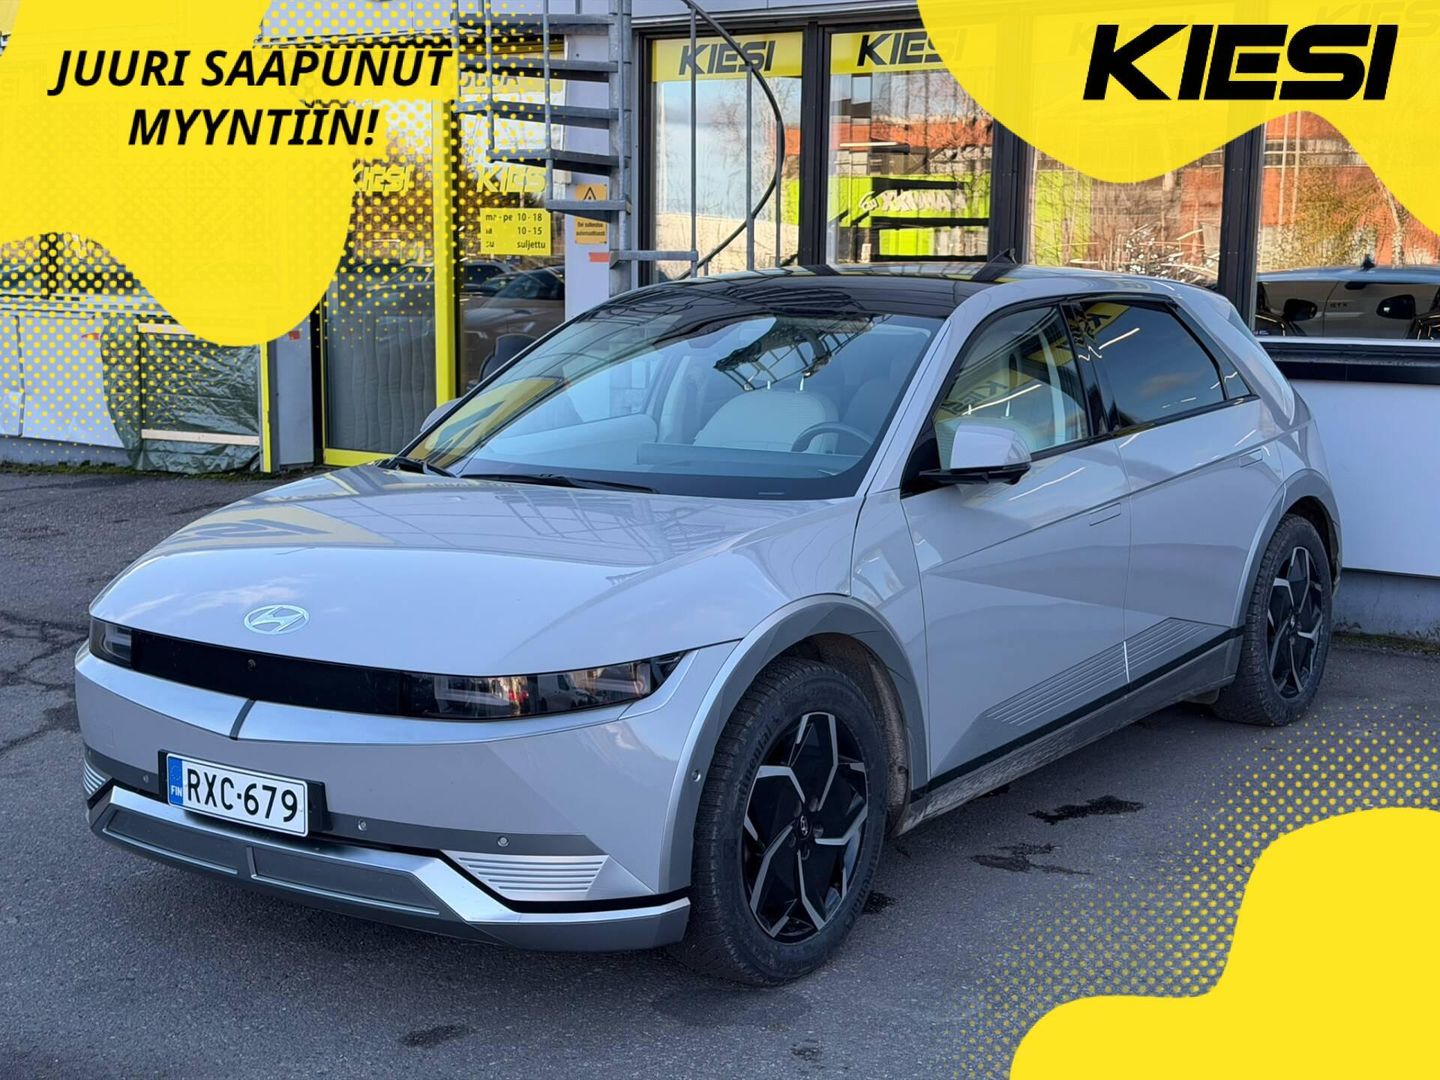 1 / 8
Ioniq 5
114 for sale · 415 sold
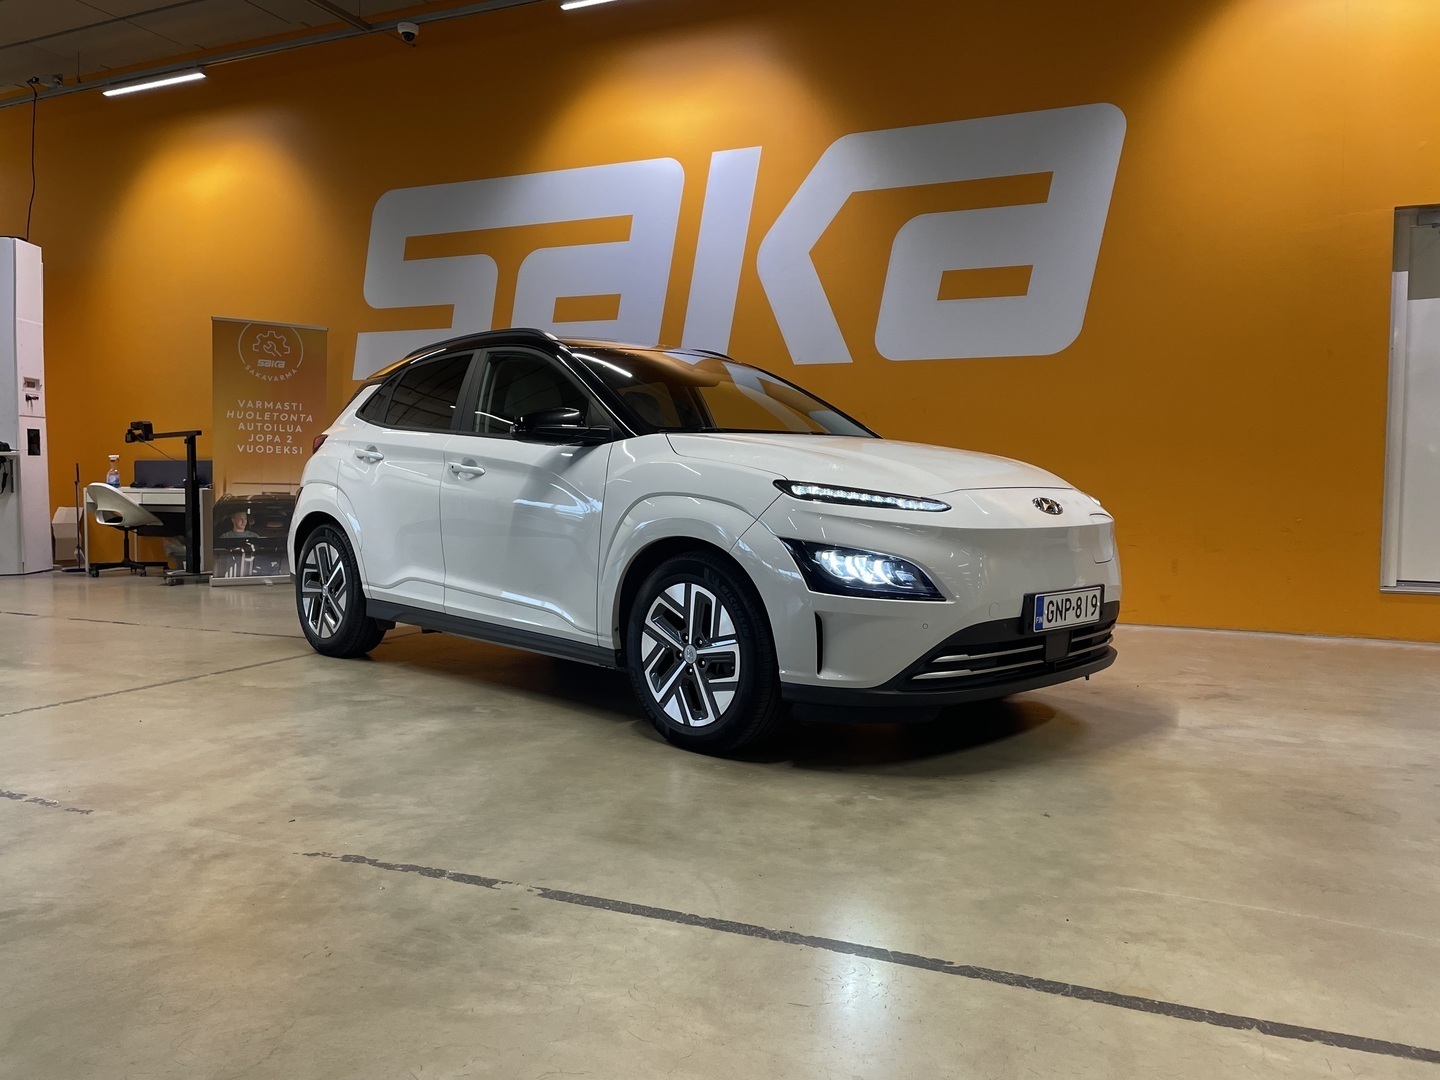 1 / 8
Kona
88 for sale · 358 sold
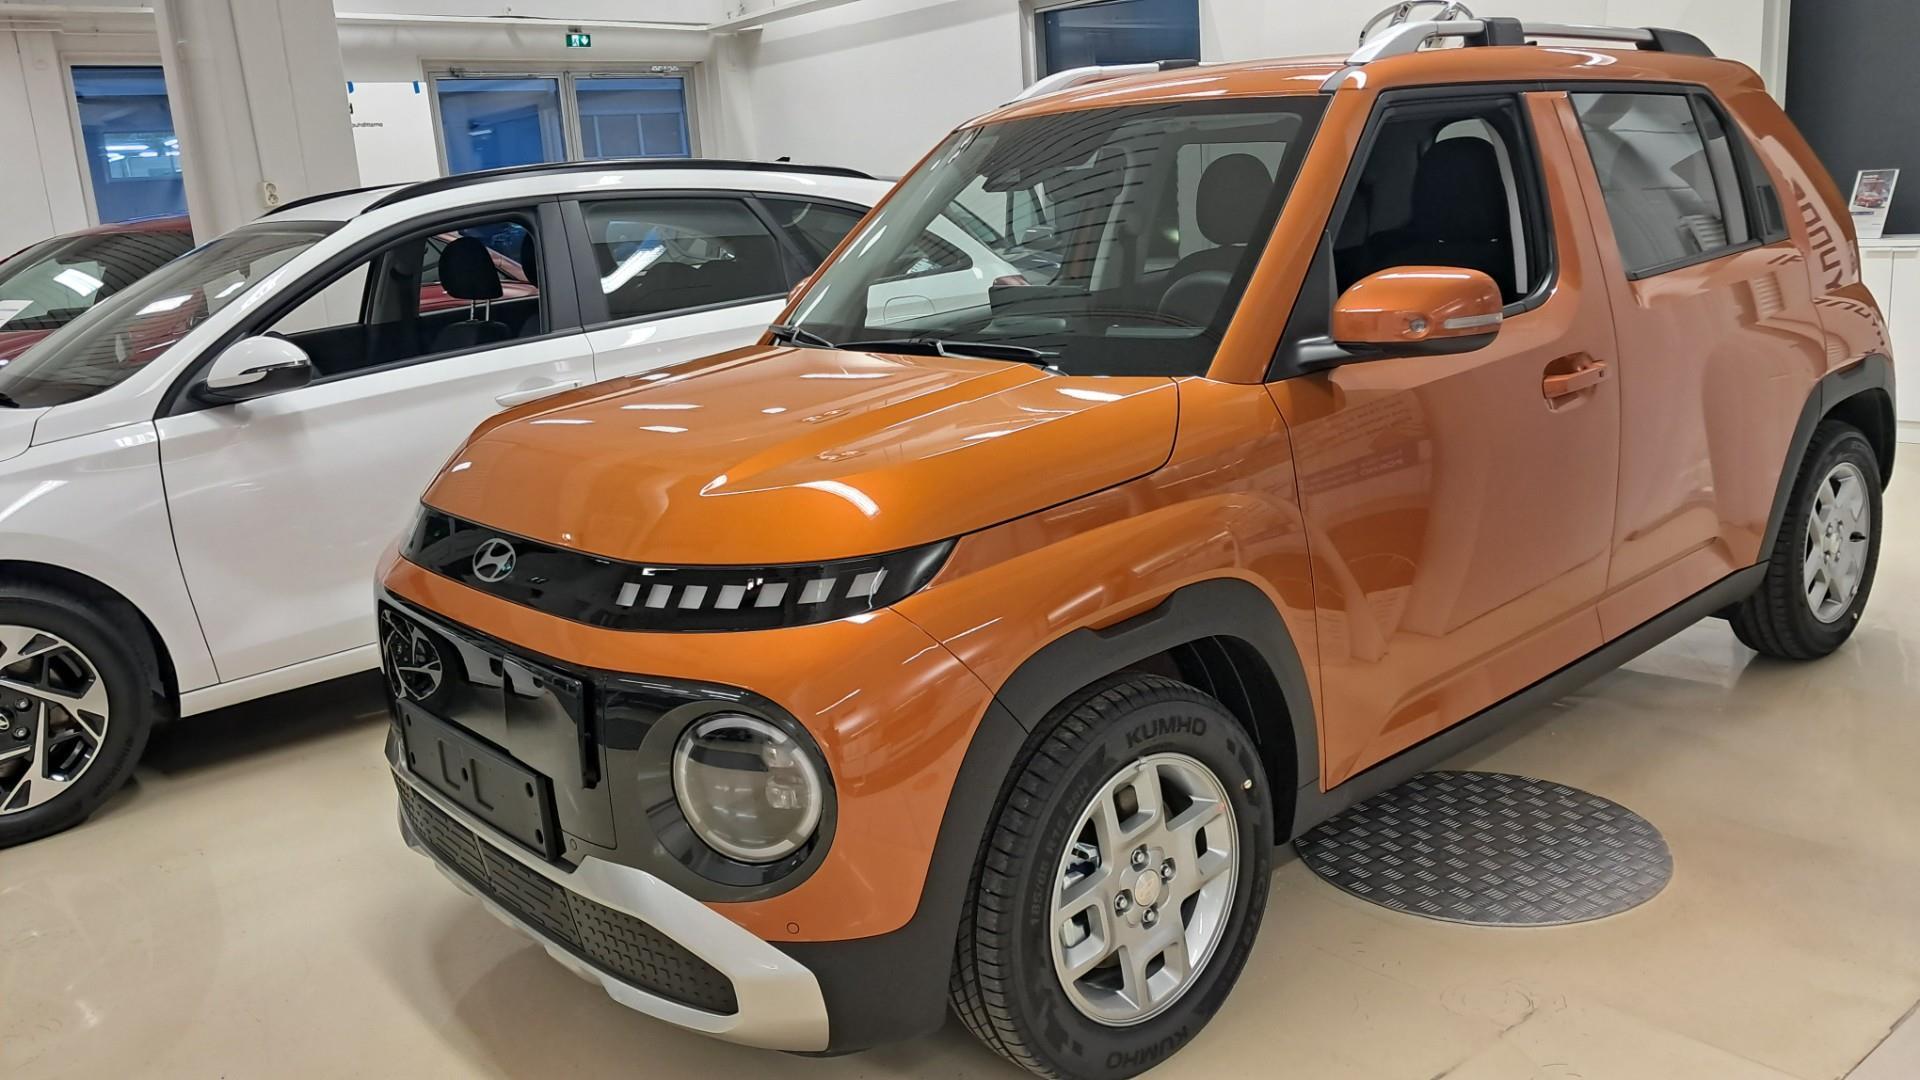 1 / 8
Inster
46 for sale · 44 sold
 1 / 8
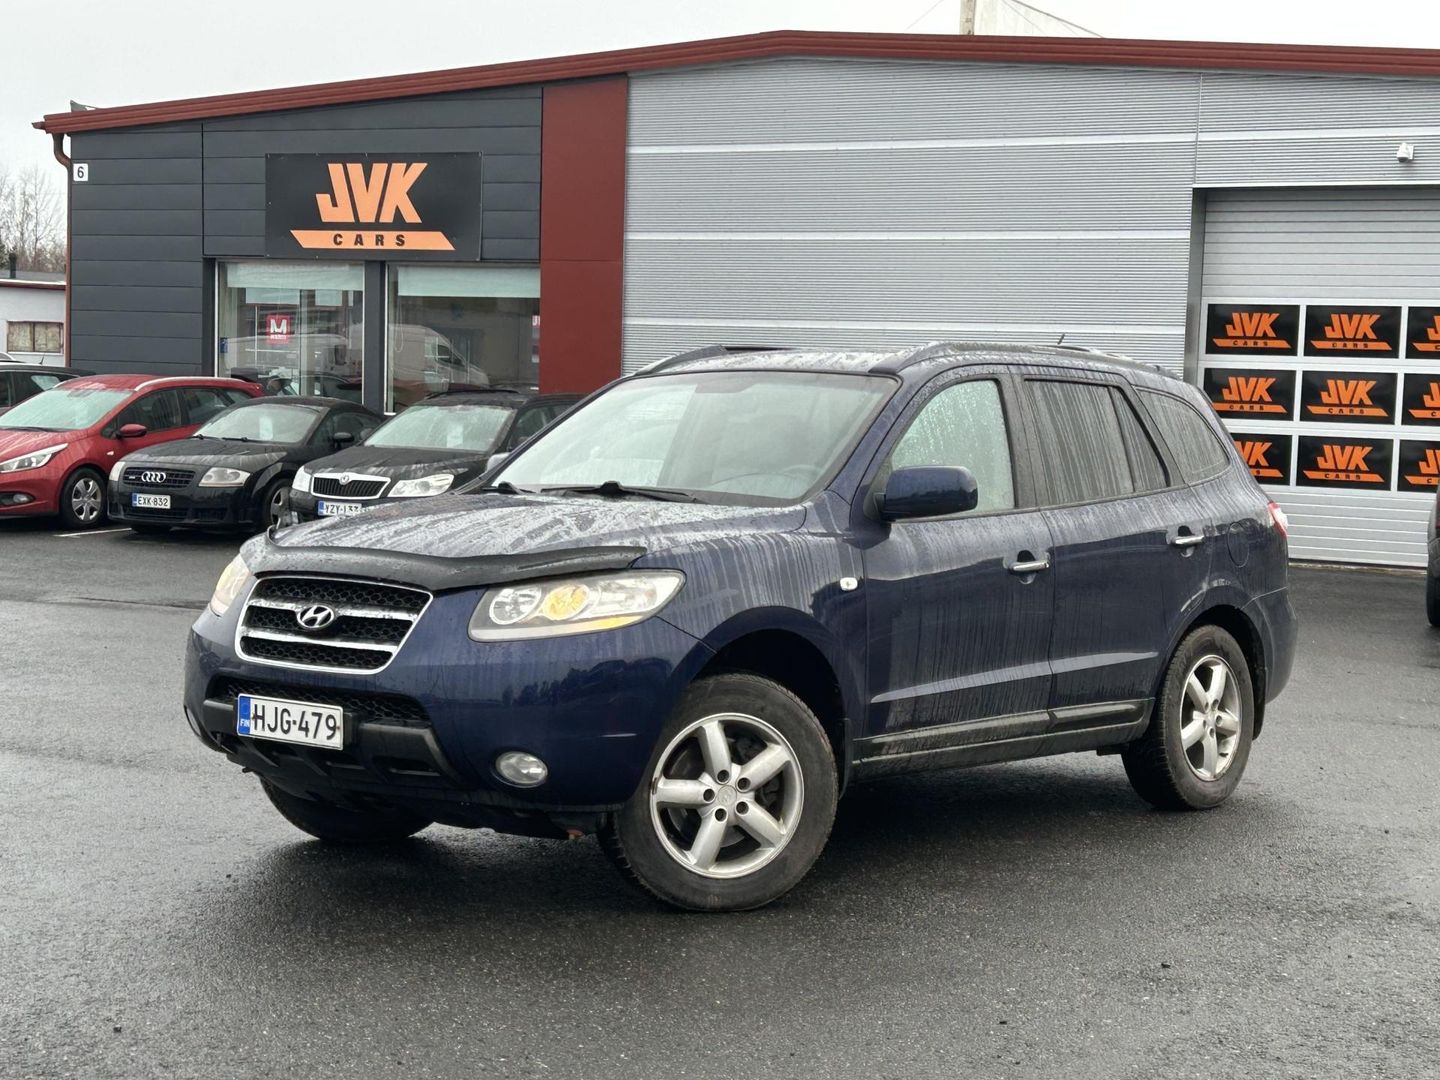
Santa Fe
44 for sale · 132 sold
 1 / 8
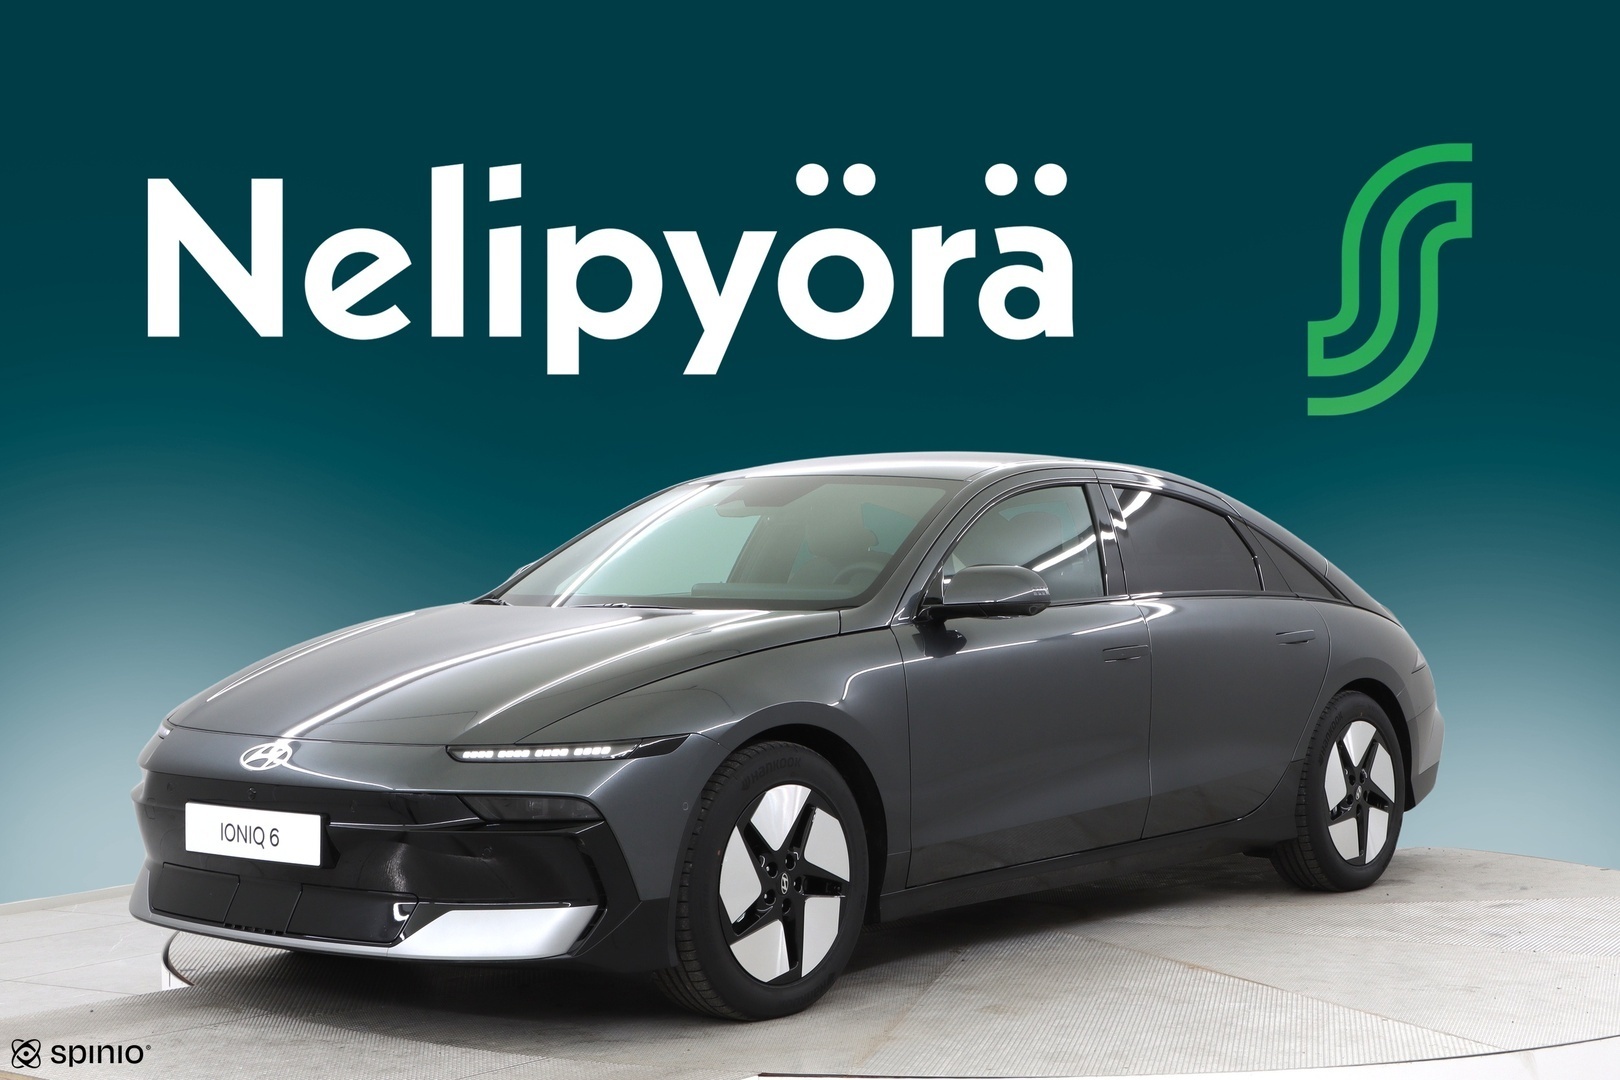
Ioniq 6
40 for sale · 121 sold
 1 / 8
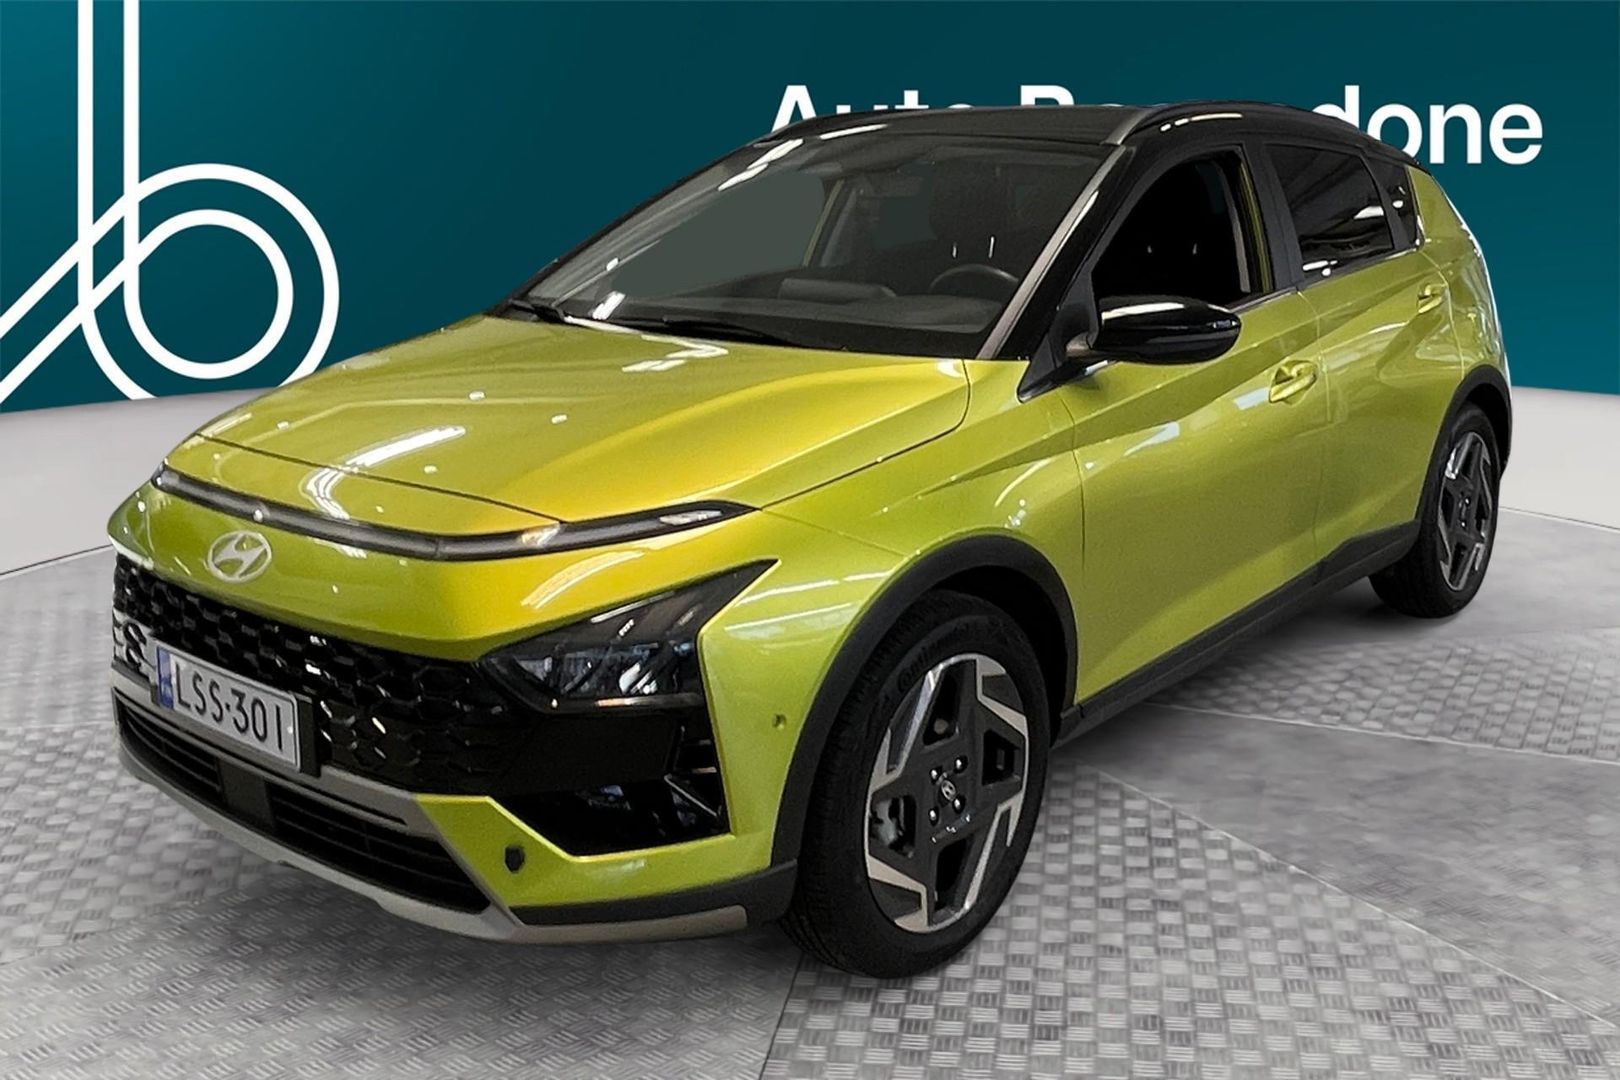
Bayon Cross
36 for sale · 28 sold
 1 / 8
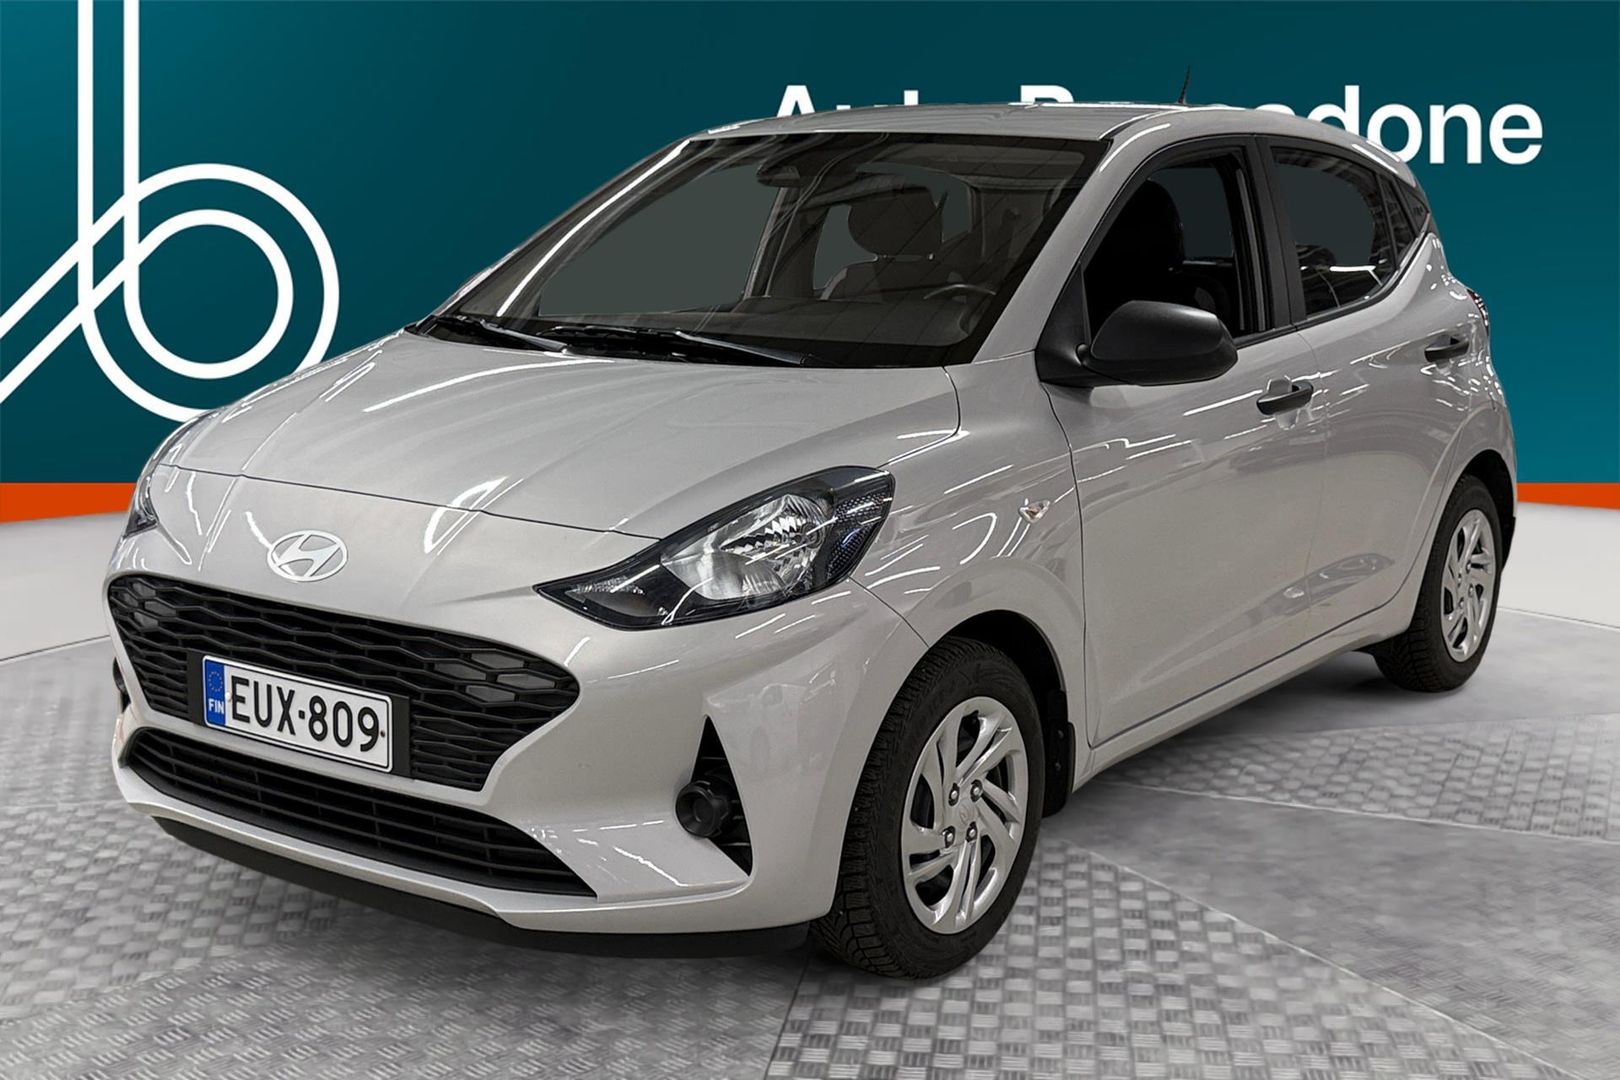
i10
28 for sale · 103 sold
1 / 8 i40
27 for sale · 150 sold
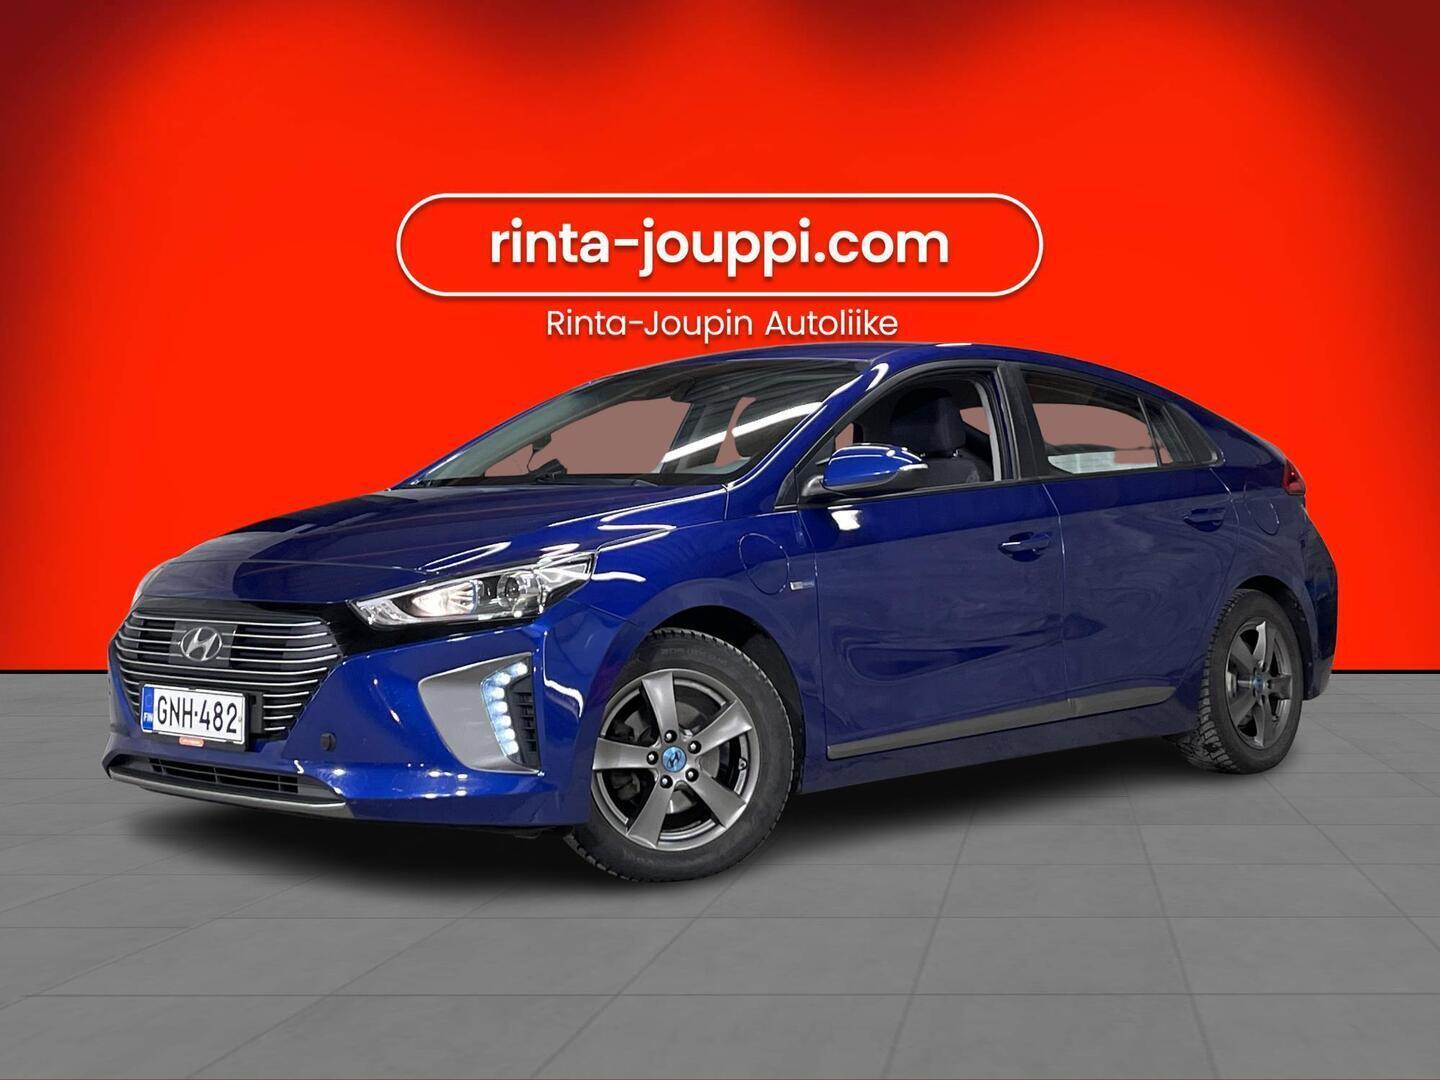 1 / 8
Ioniq Plug-In
27 for sale · 82 sold
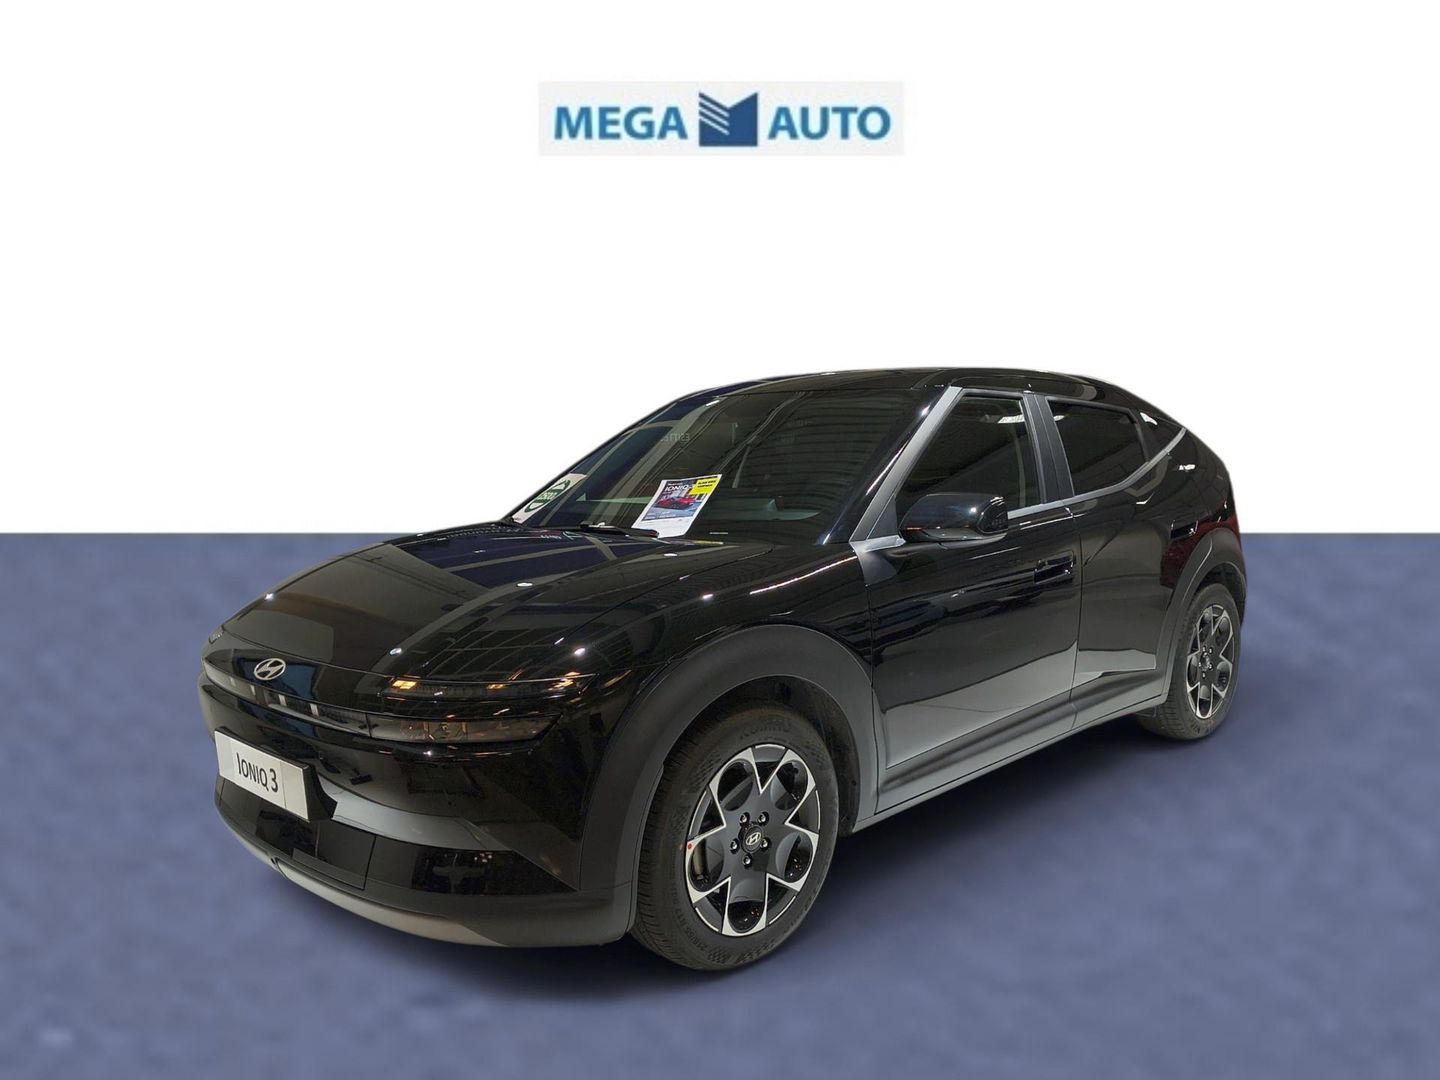 1 / 8
Ioniq 3
22 for sale · 1 sold
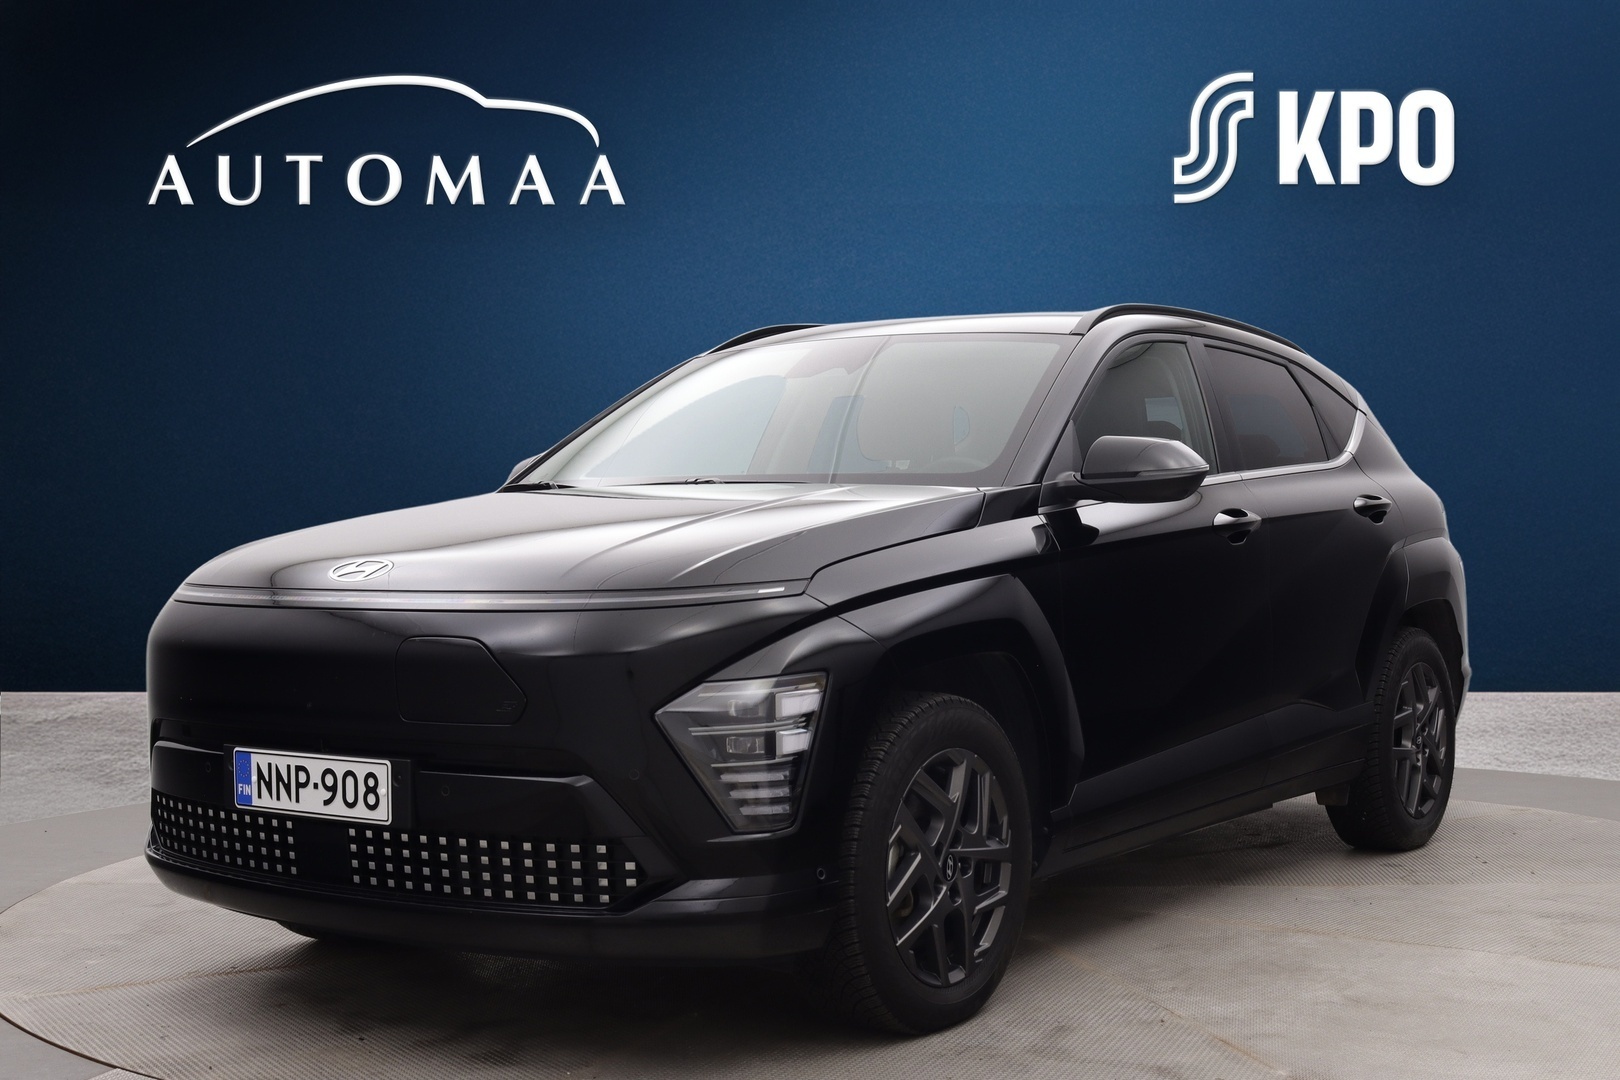 1 / 8
Kona Electric
21 for sale · 63 sold
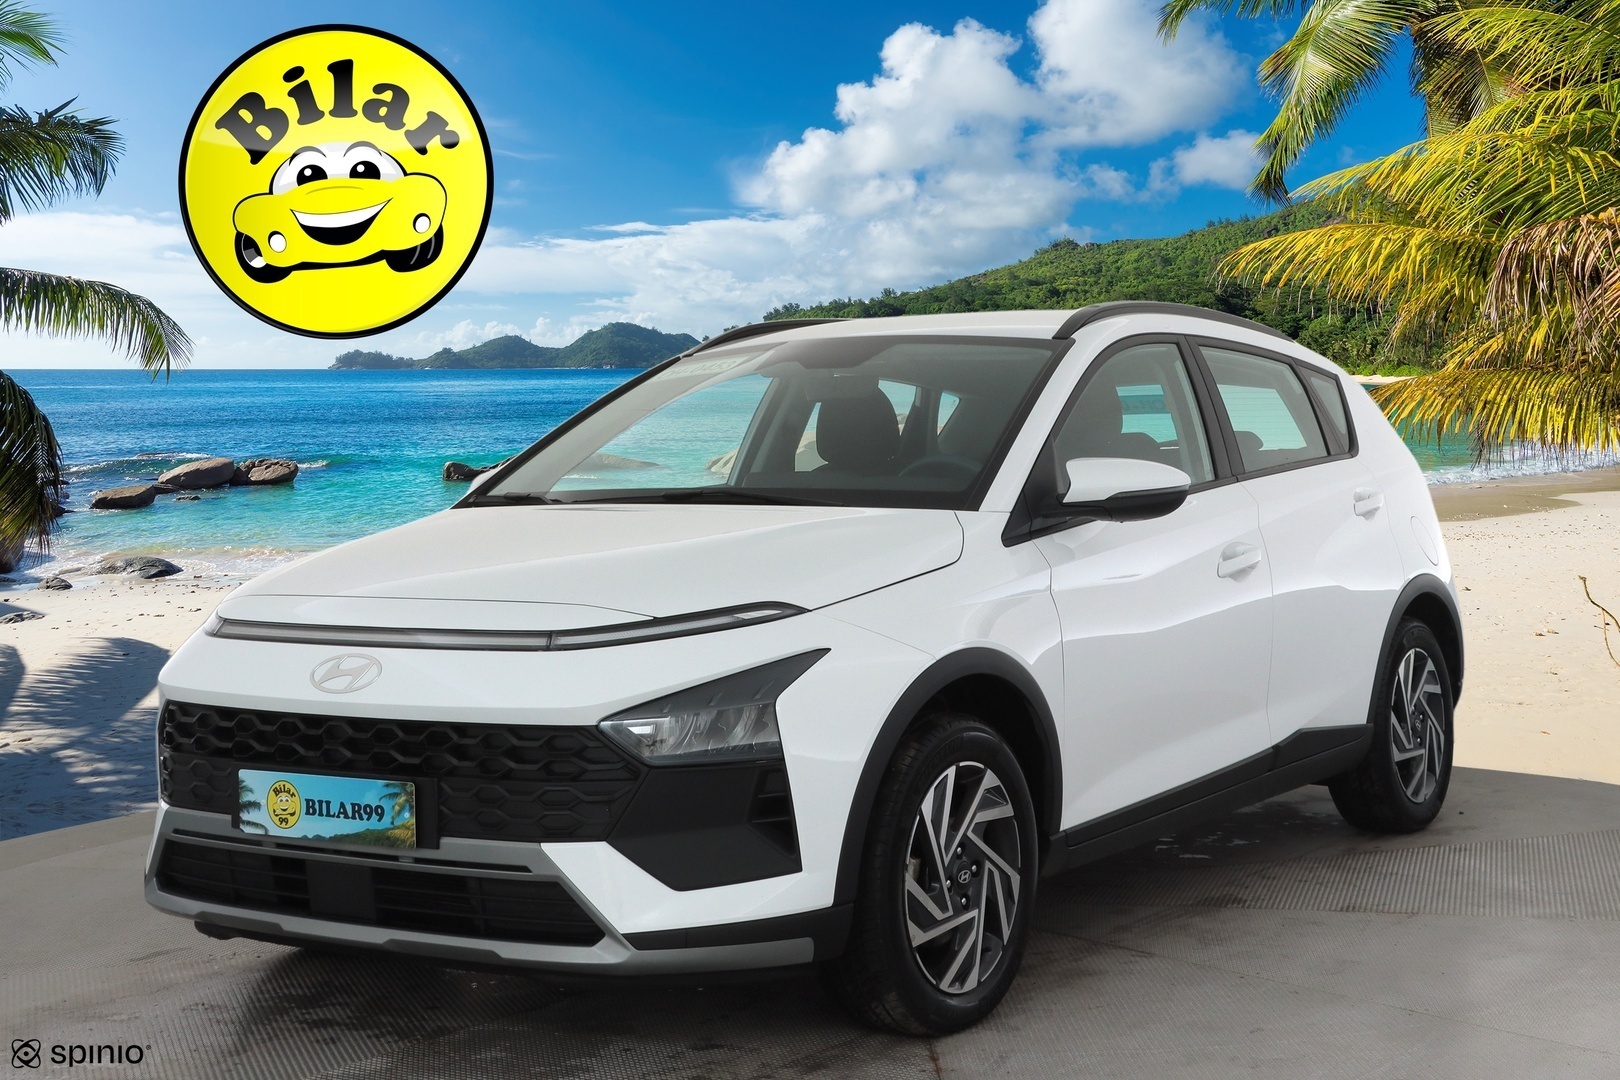 1 / 8
Bayon
19 for sale · 33 sold
9,299 €
J. Rinta-Jouppi Lappeenranta, Etelä-Karjala

8,780 €
Nelipyörä Seinäjoki, Etelä-Pohjanmaa
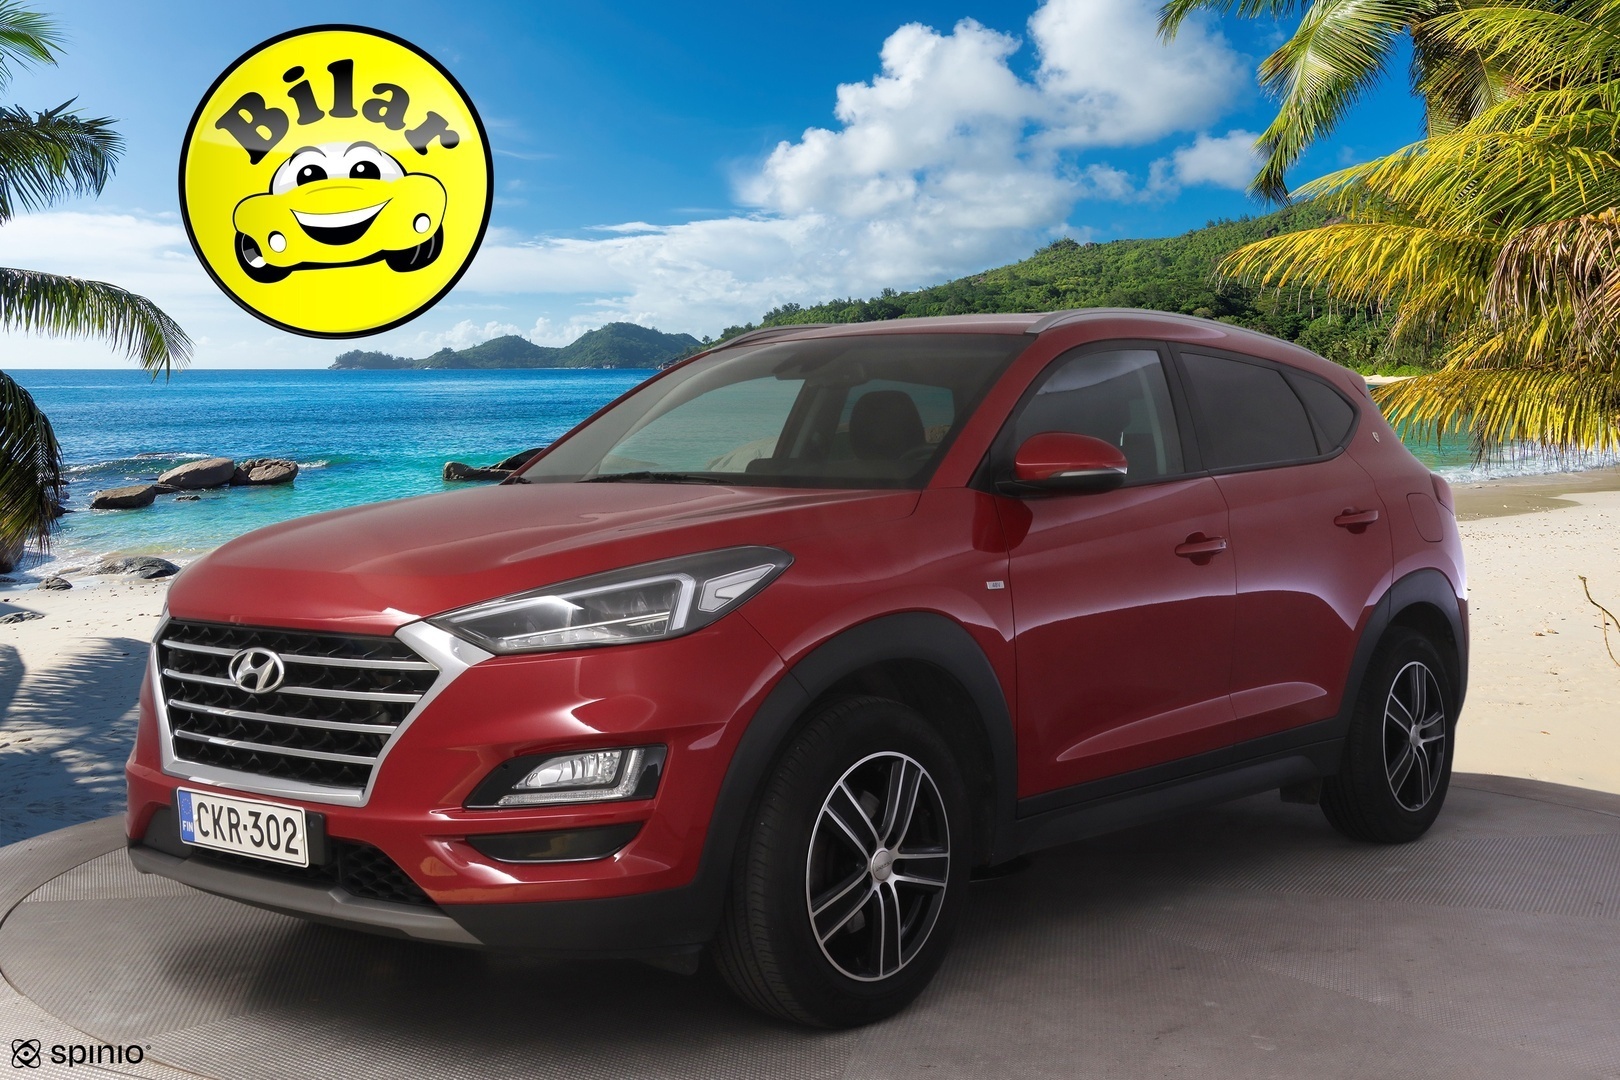
16,990 €
Bilar99 - Helsinki, Uusimaa
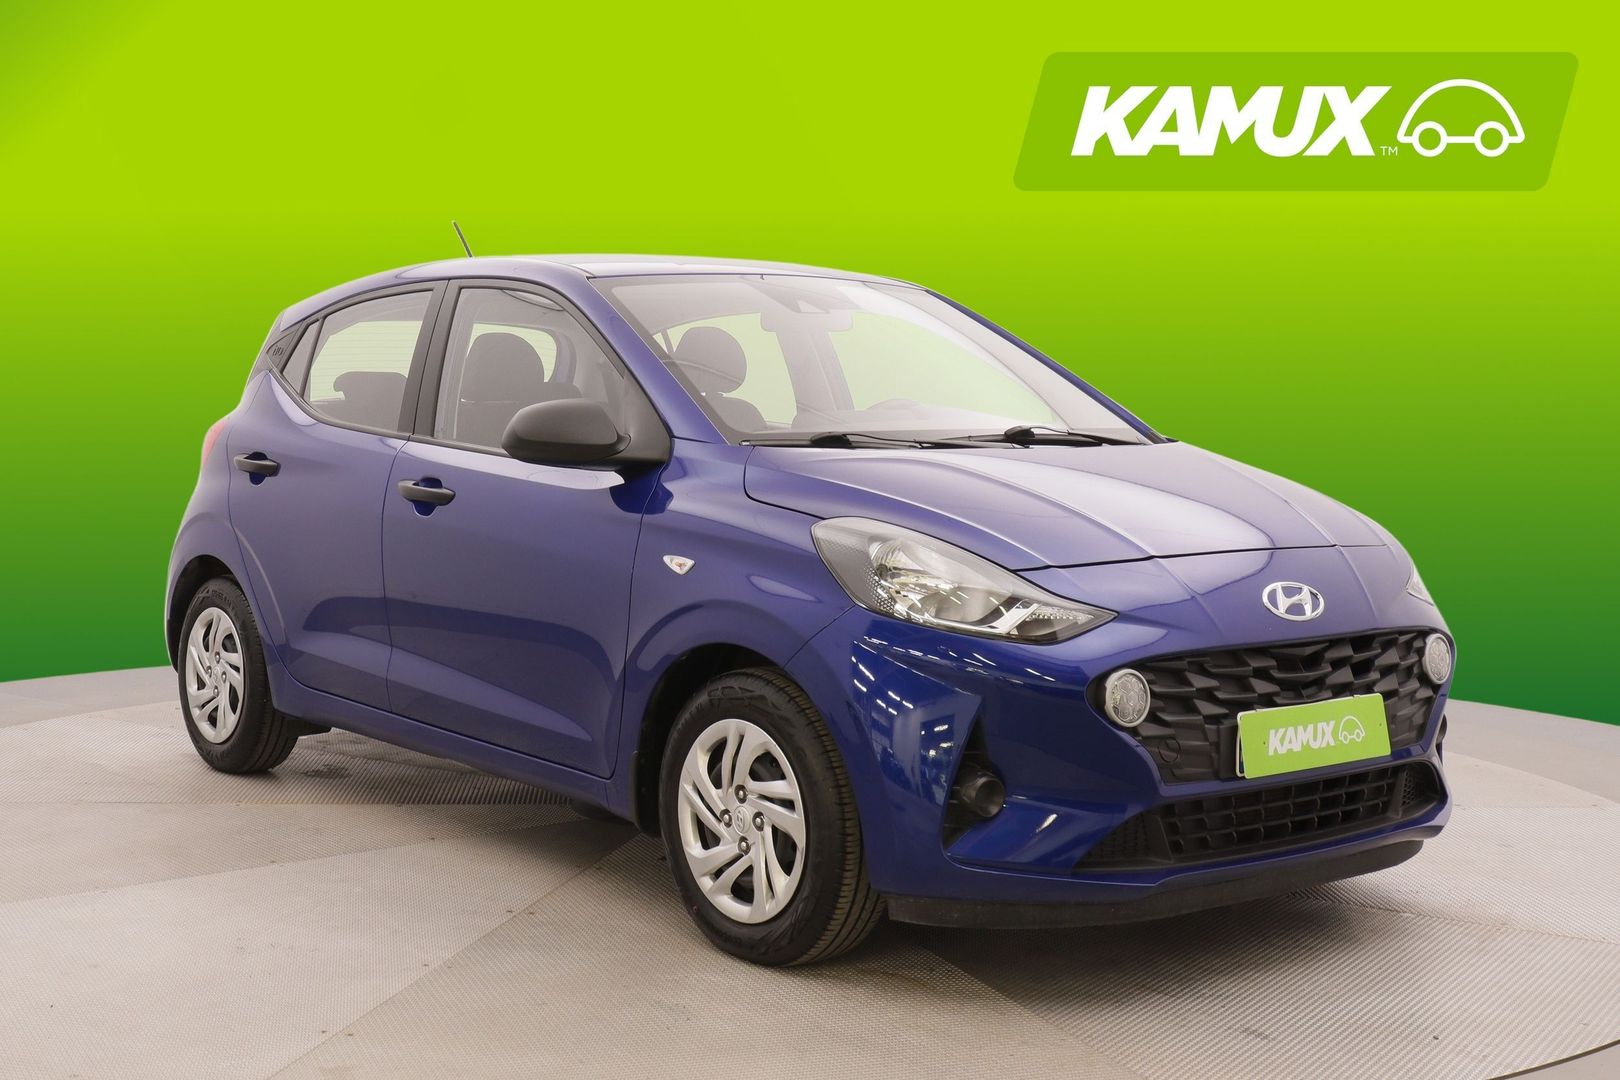
9,490 €
Kamux Espoo Niittykumpu, Espoo, Uusimaa

8,400 €
Auto-Suni, Lappeenranta, Etelä-Karjala
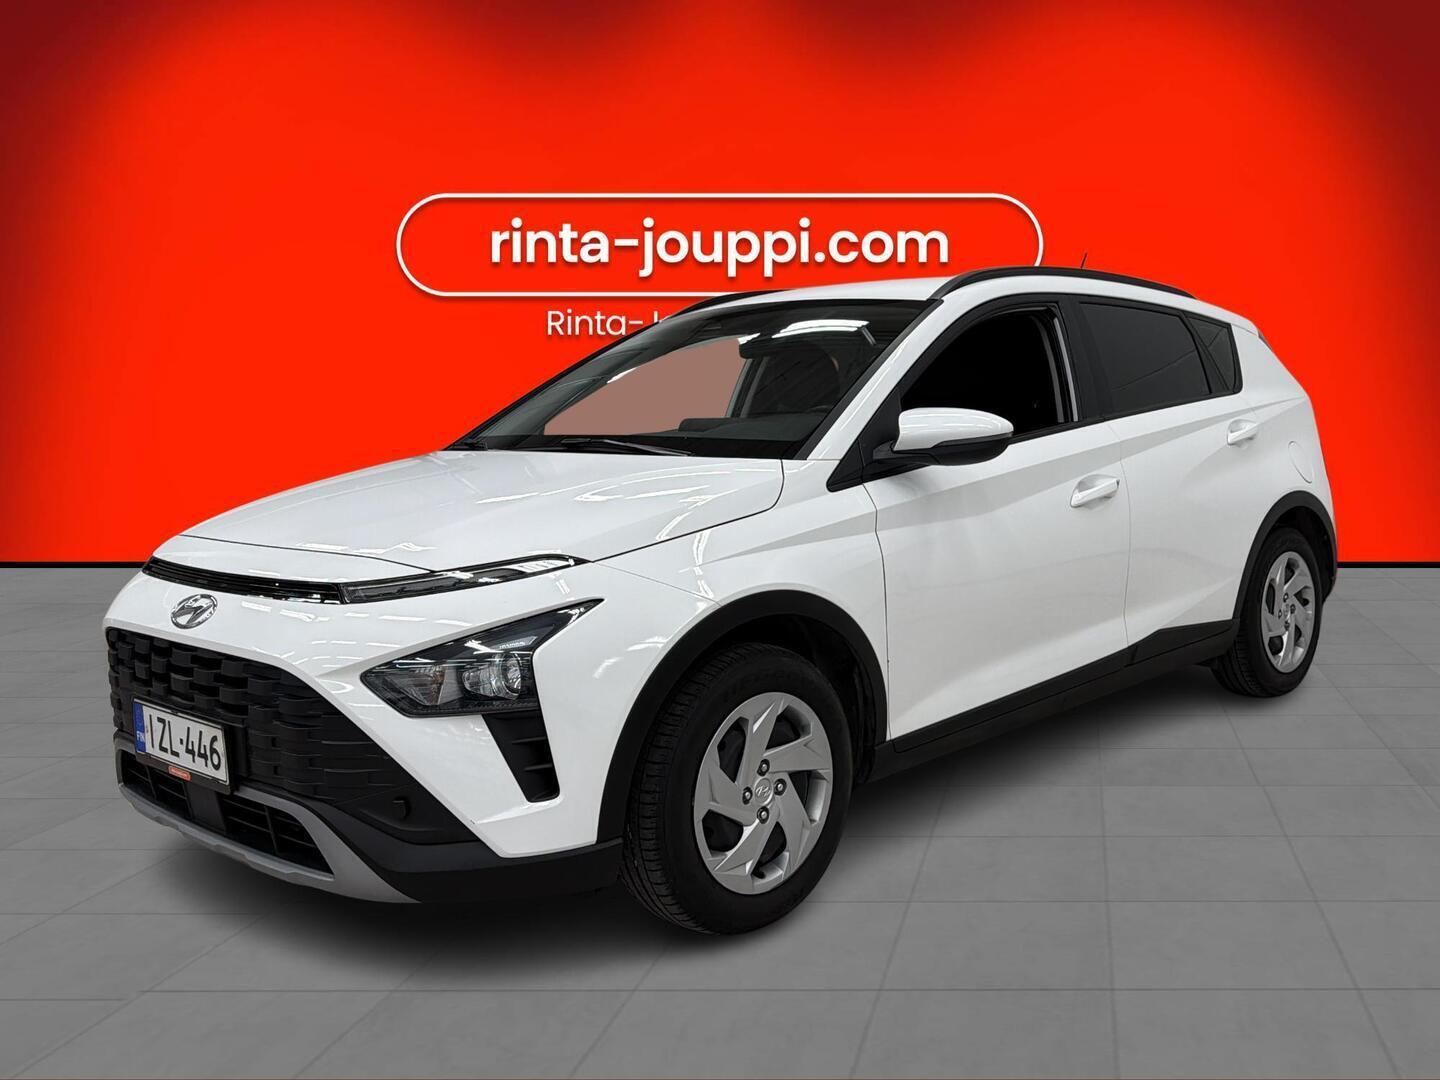
8,990 €
Rinta-Joupin Autoliike Kuopio, Pohjois-Savo
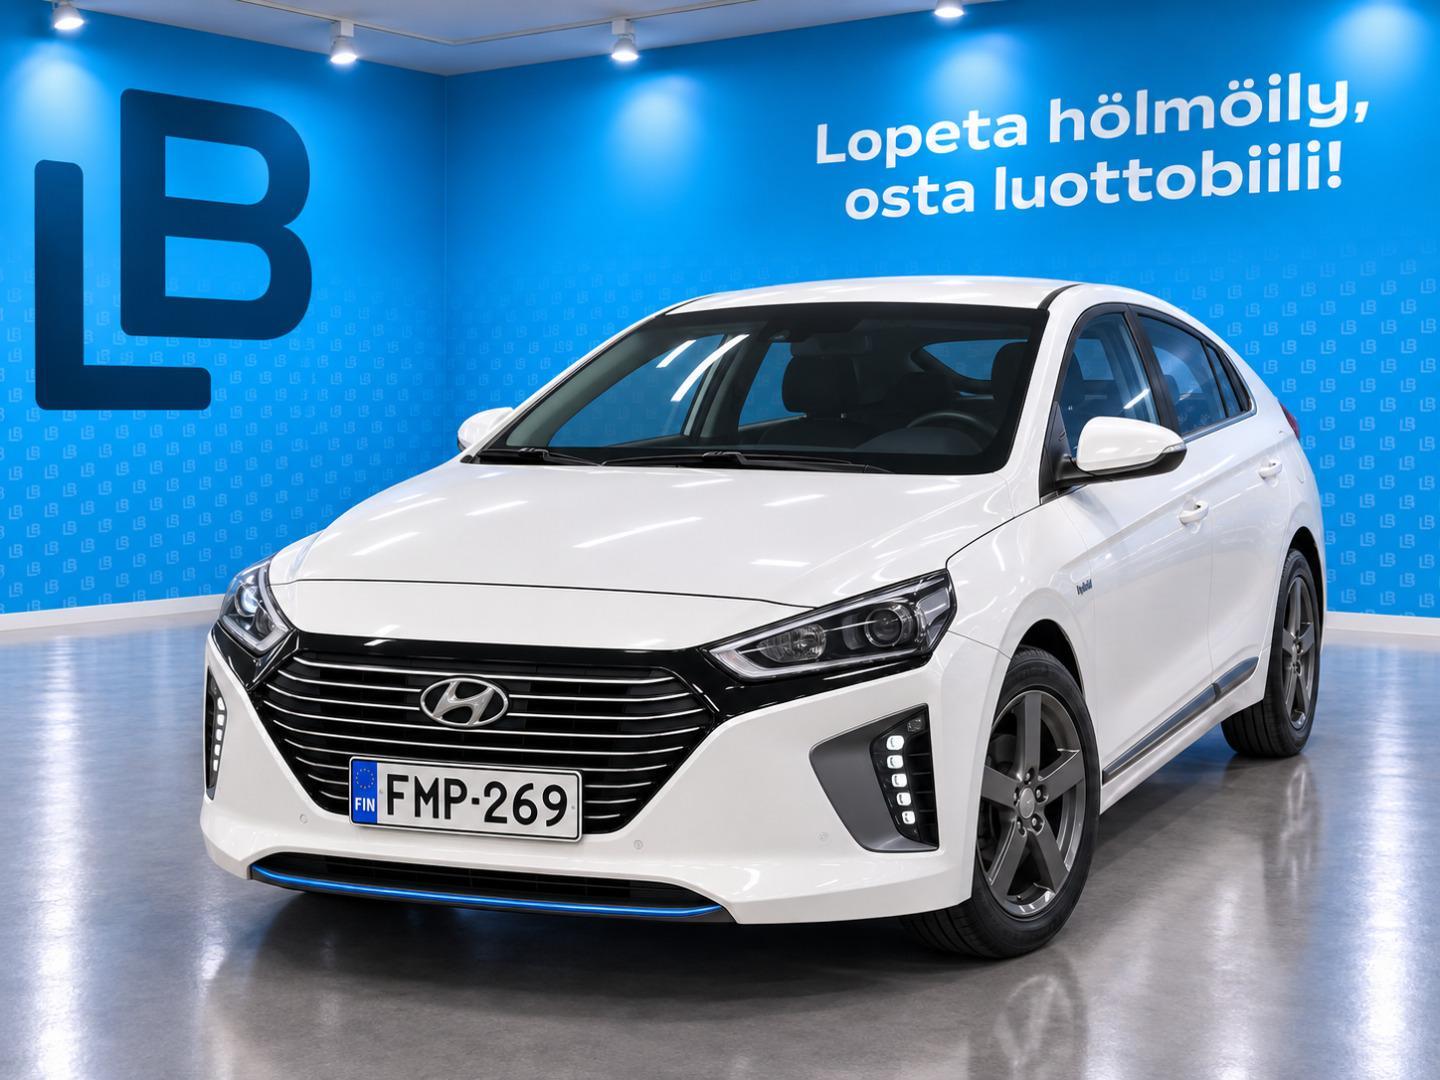
9,990 €
Luottobiili Oy, Tampere, Pirkanmaa
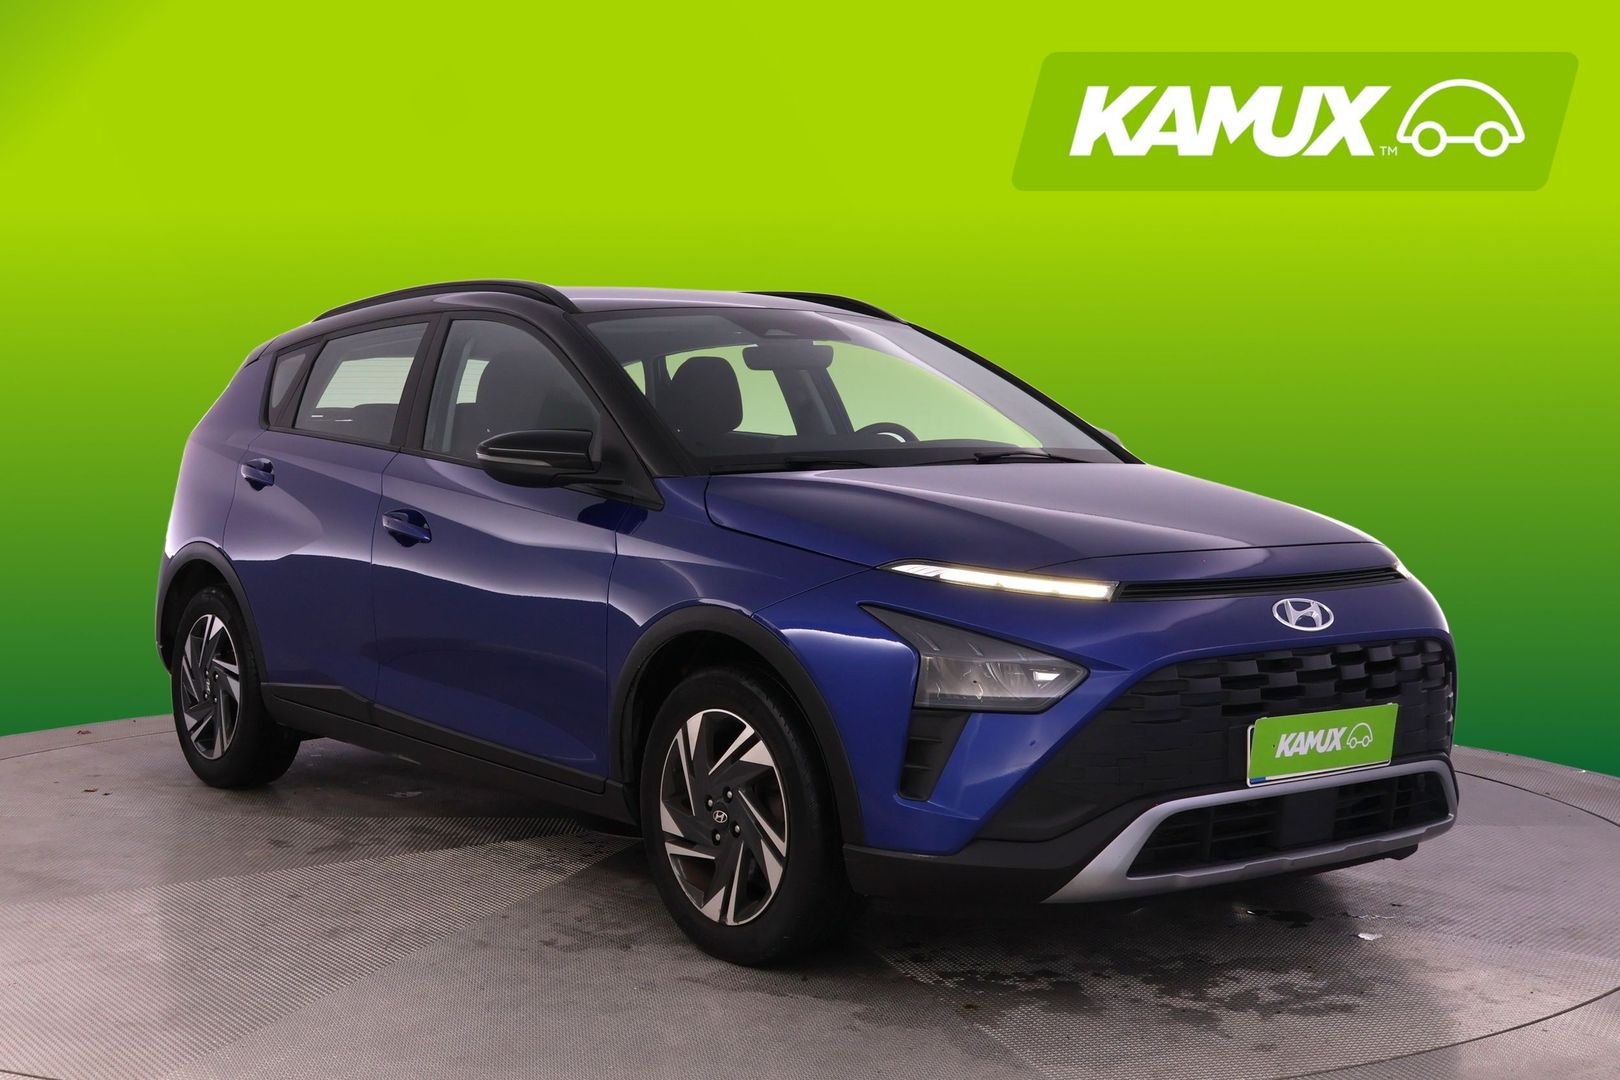
12,990 €
Kamux Espoo Friisilä, Espoo, Uusimaa

13,880 €
Vaihtoautomaa Lahti, Päijät-Häme

13,890 €
Bilar99 - Helsinki, Uusimaa
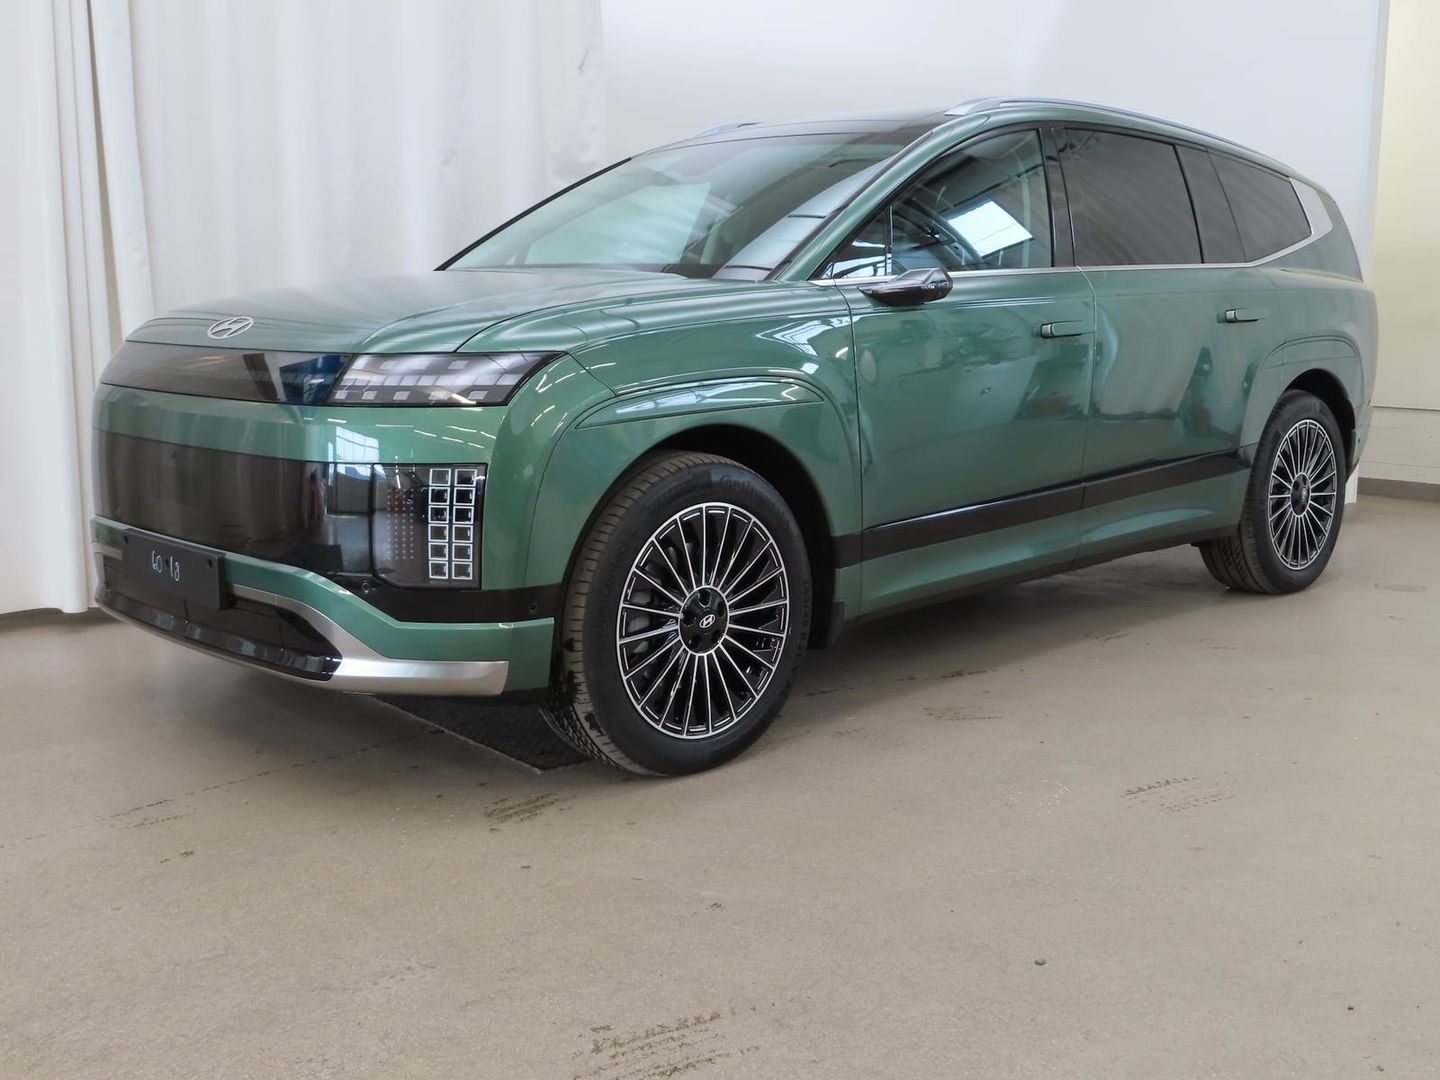
79,900 €
Pörhön Autoliike monimerkki Oulu, Pohjois-Pohjanmaa
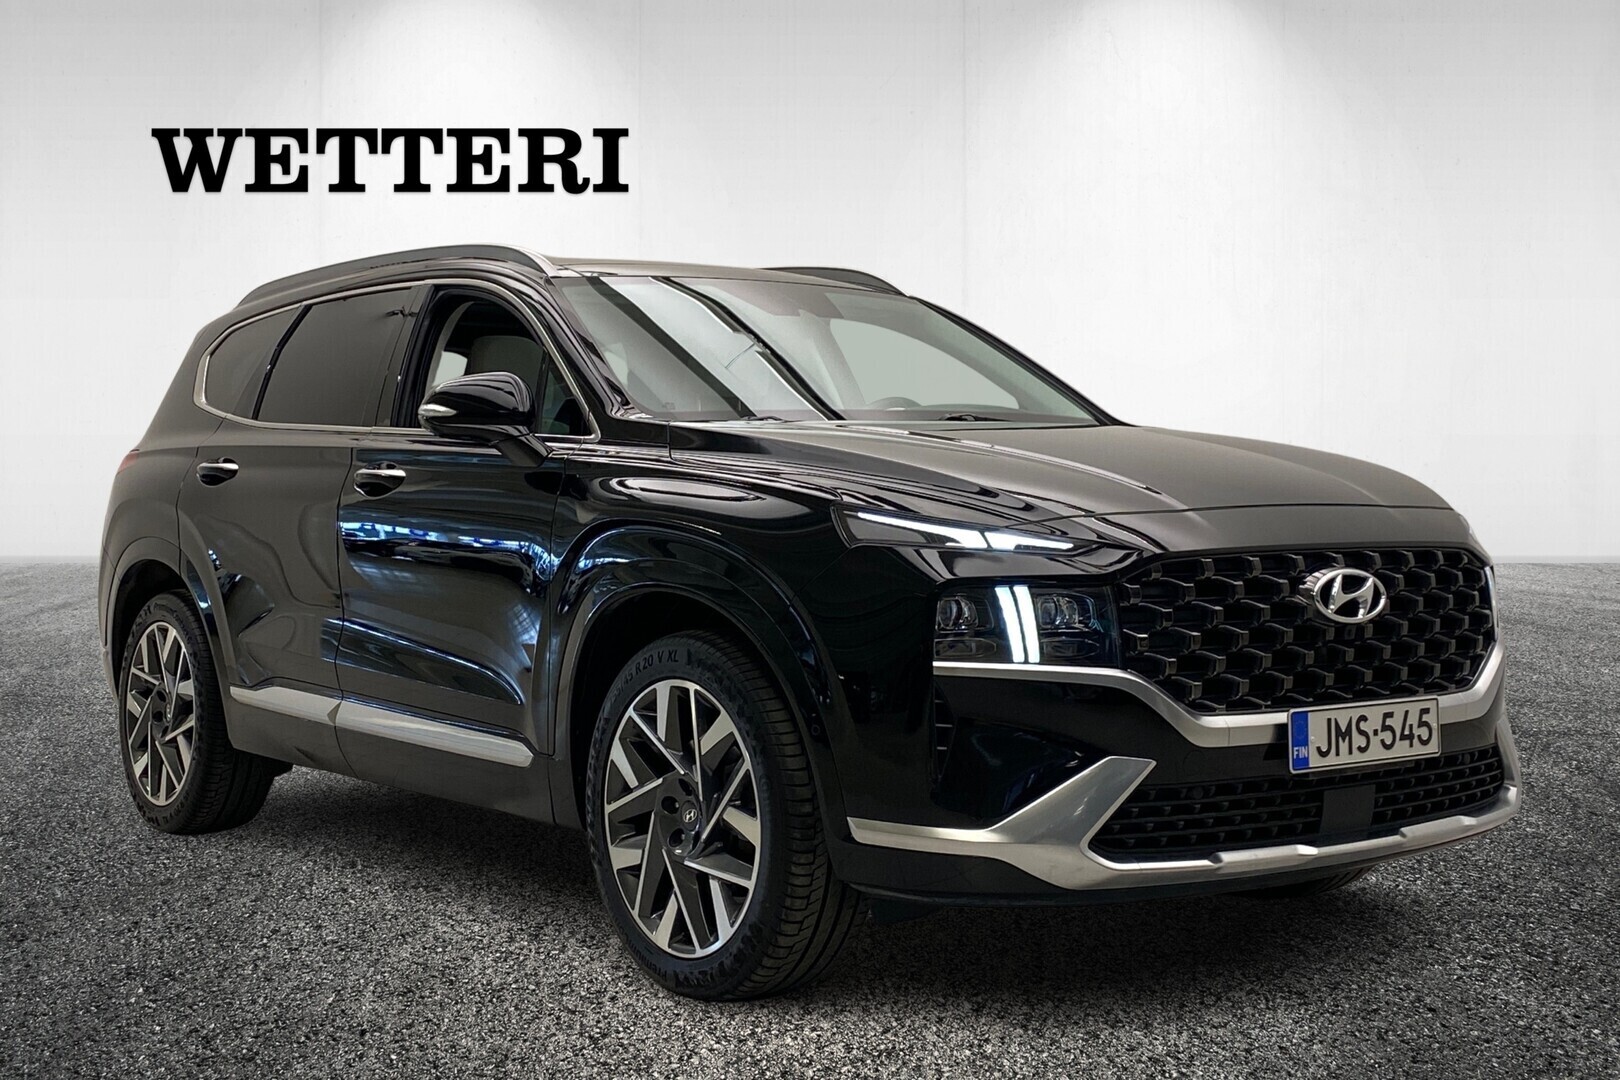
39,900 €
Wetteri Kuopio, Pohjois-Savo
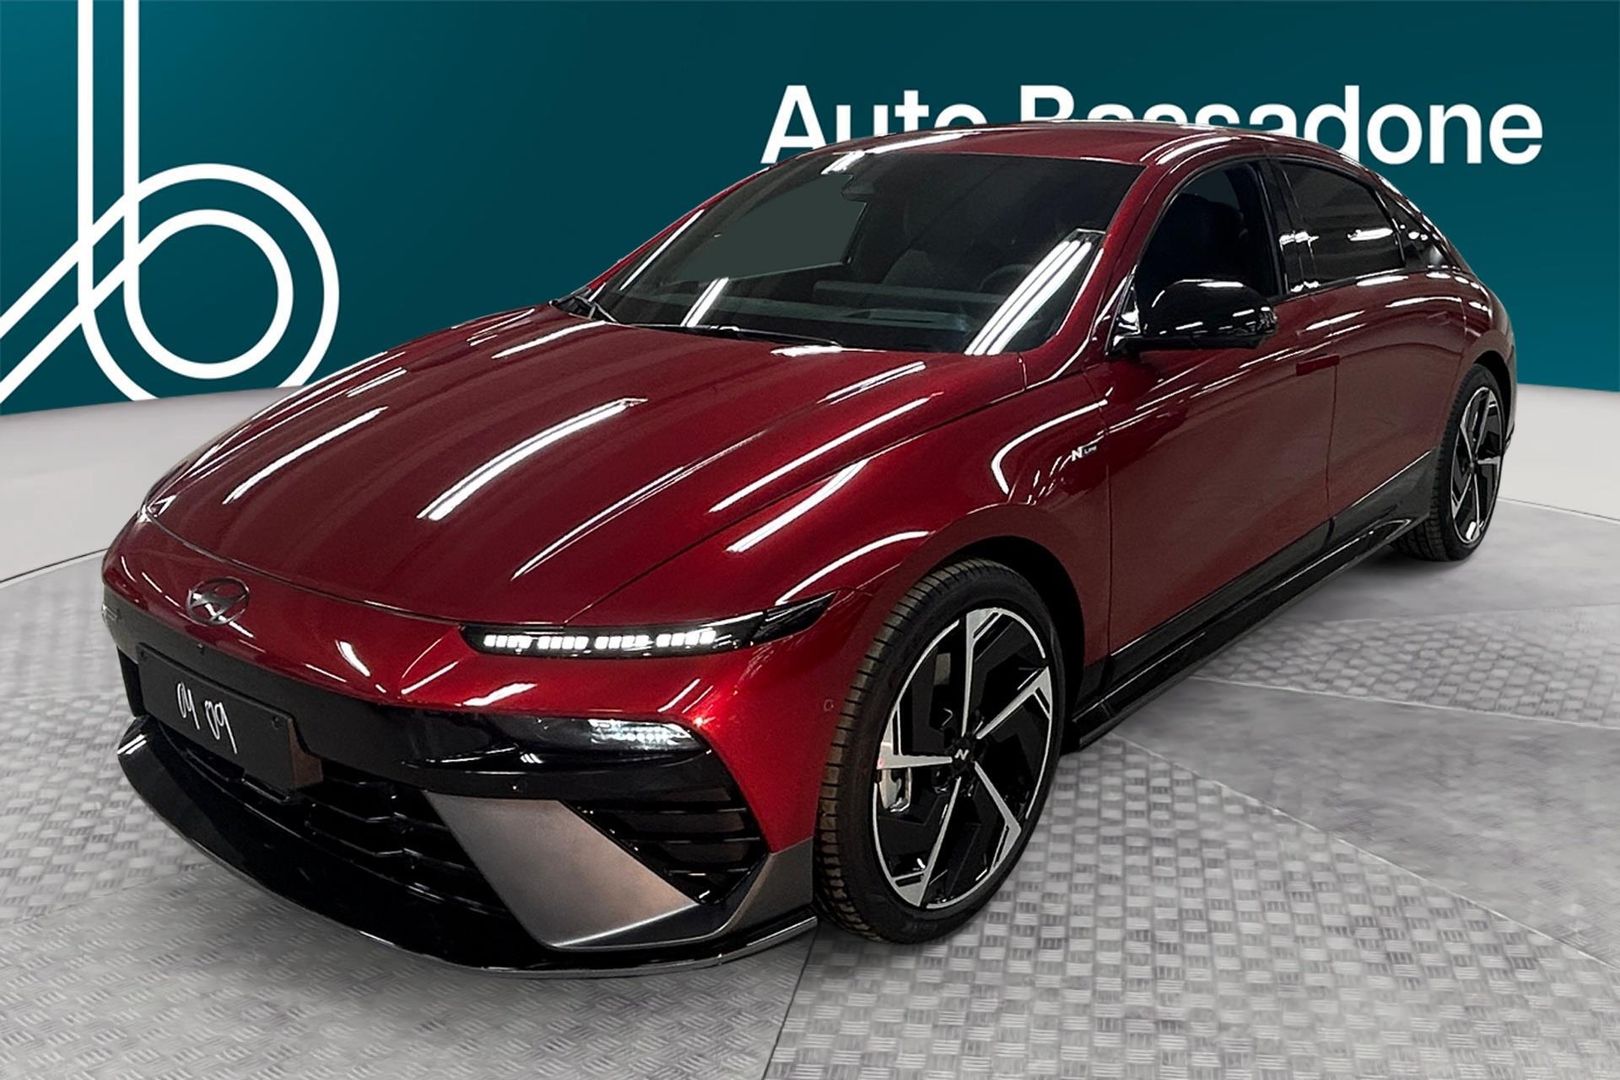
49,990 €
Auto Bassadone Helsinki, Uusimaa
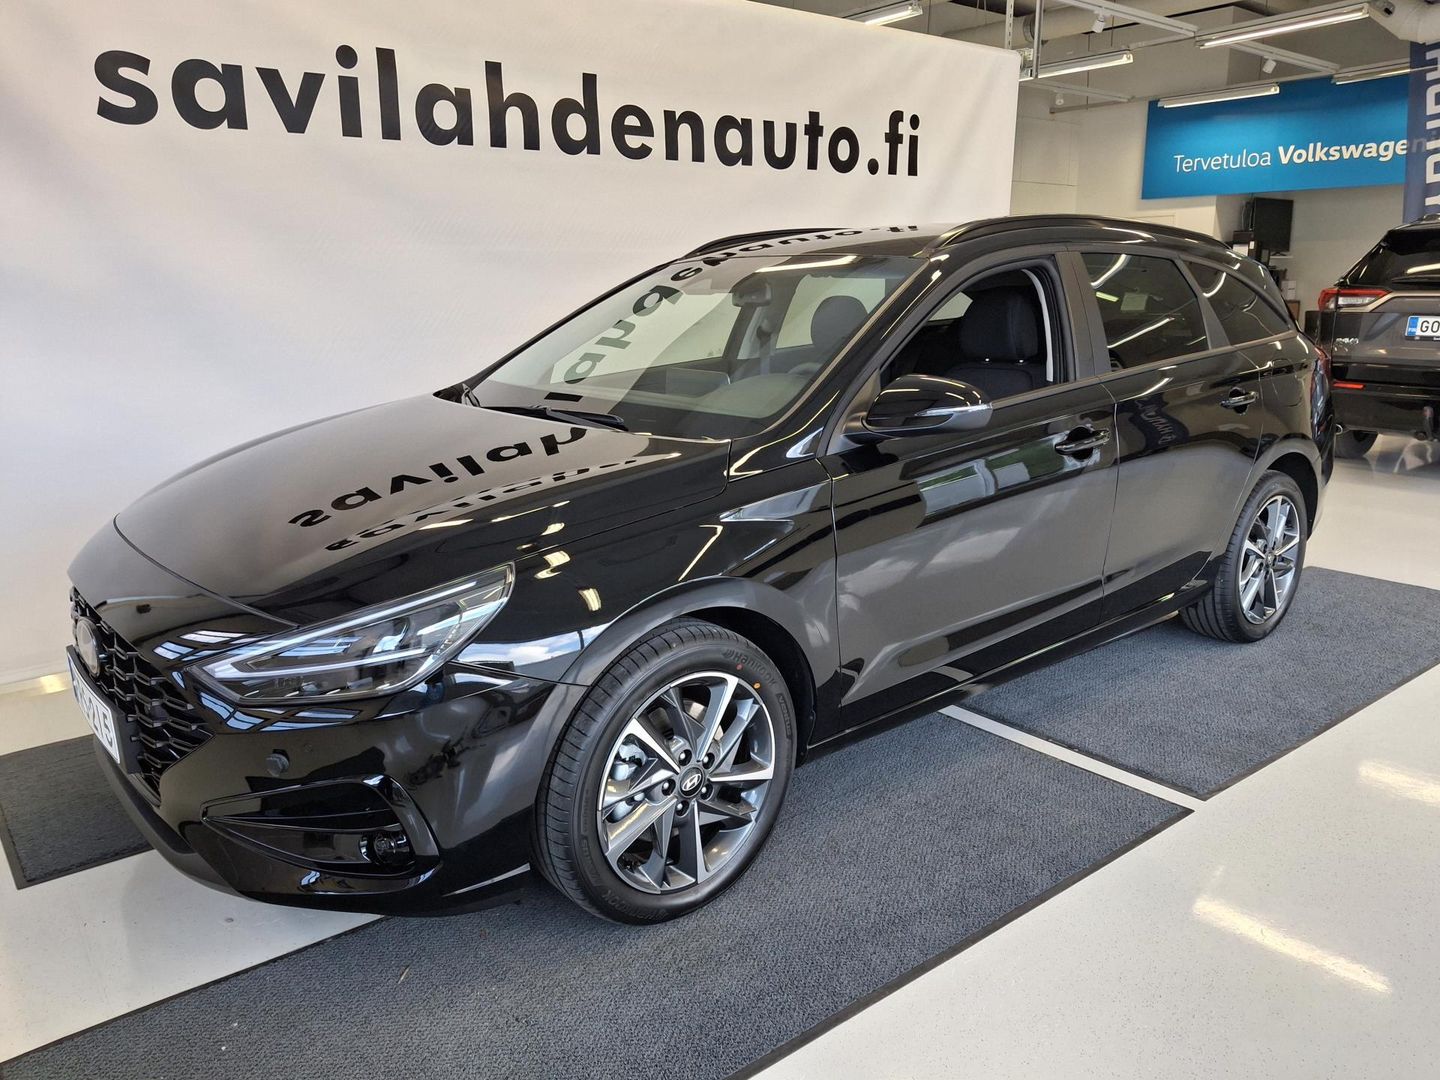
31,500 €
Savilahden Auto Oy Savonlinna, Etelä-Savo
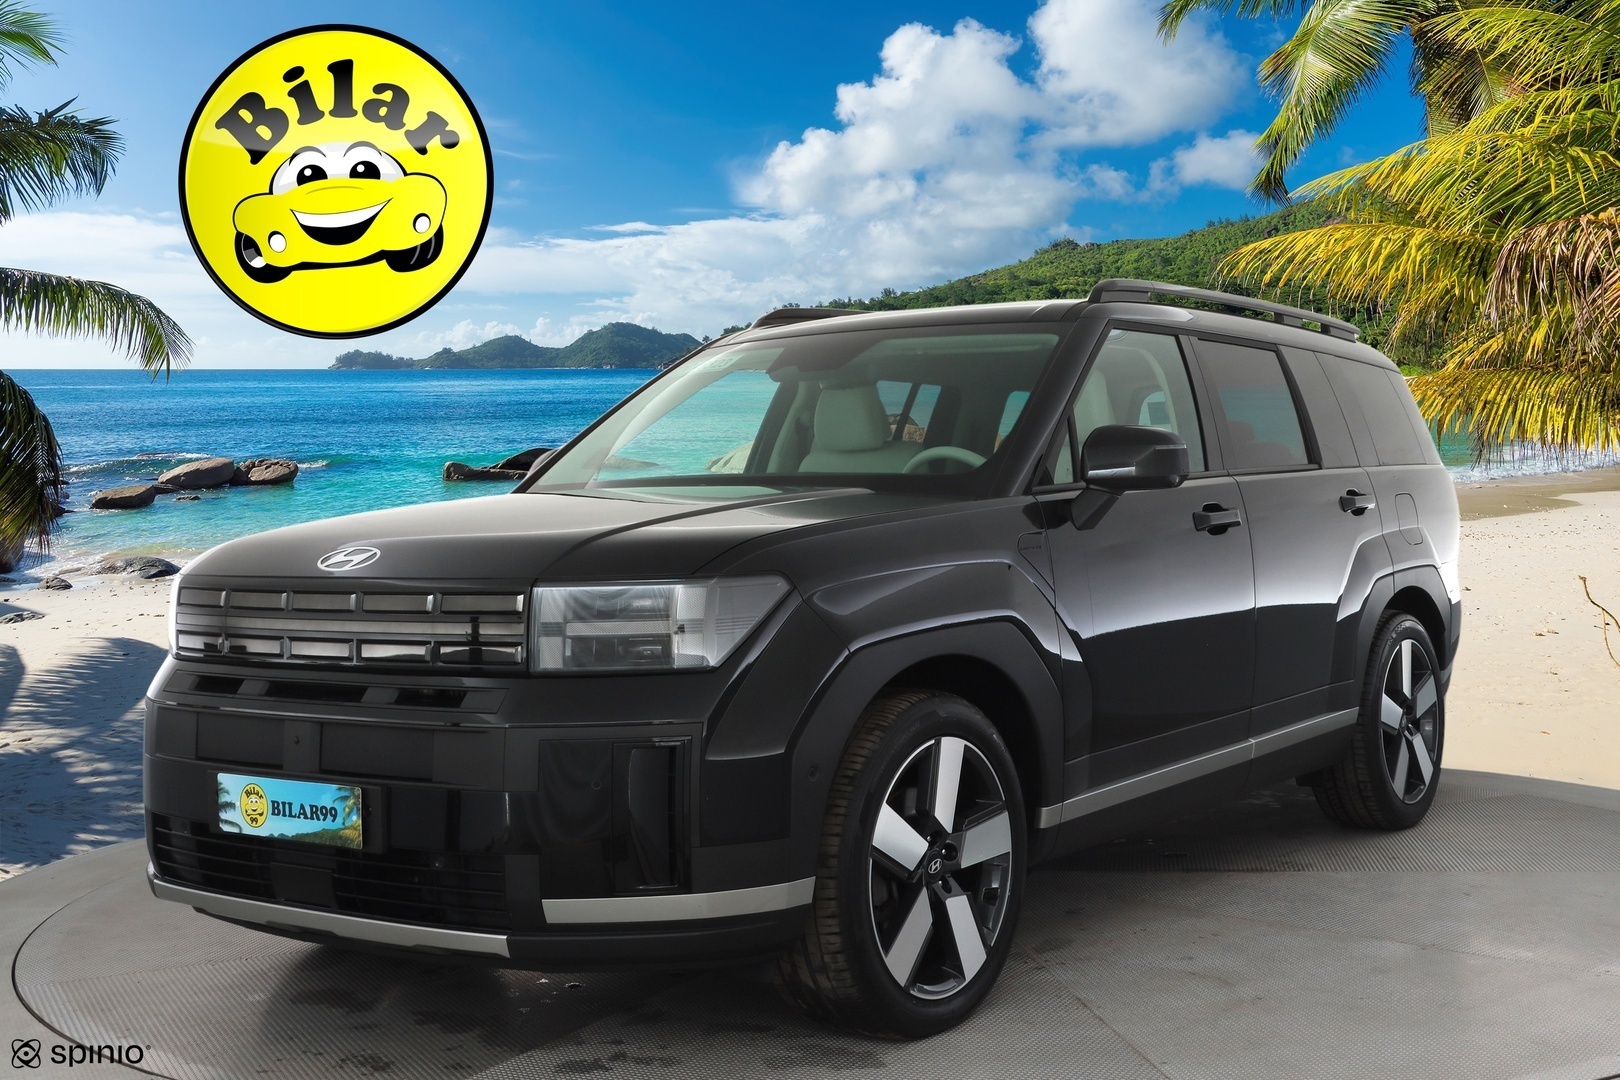
46,290 €
Bilar99 - Espoo, Uusimaa
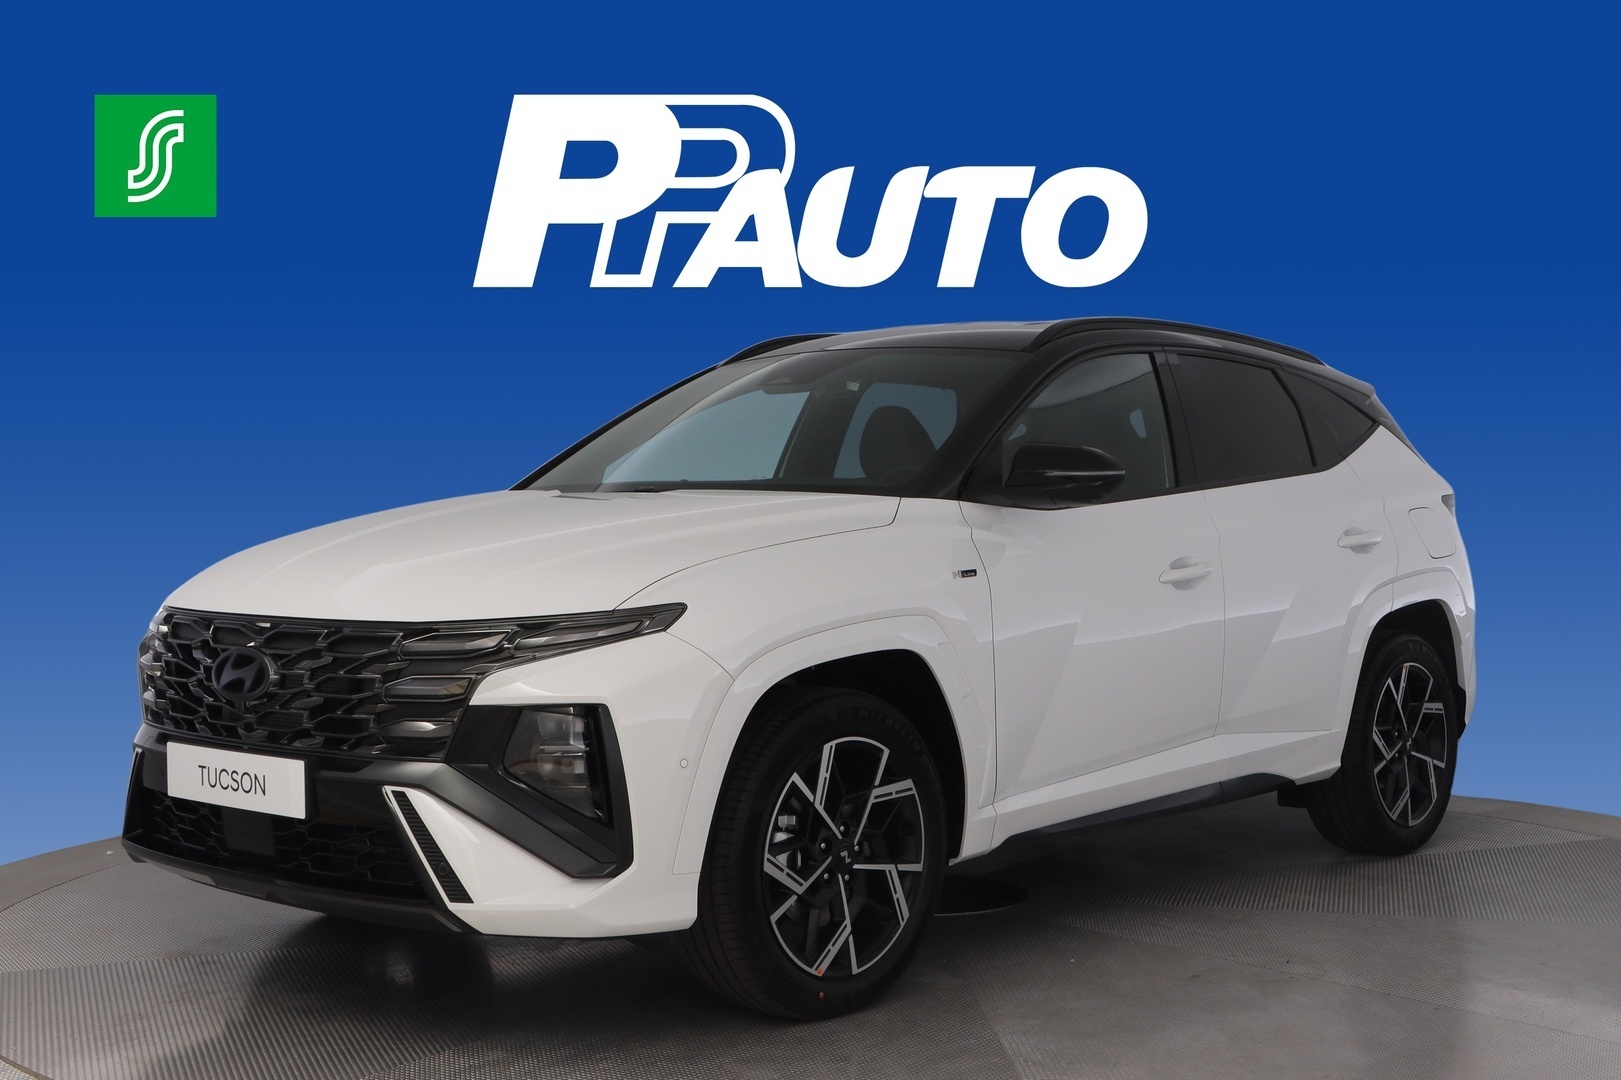
43,700 €
PP-auto Oy, Lohja, Uusimaa
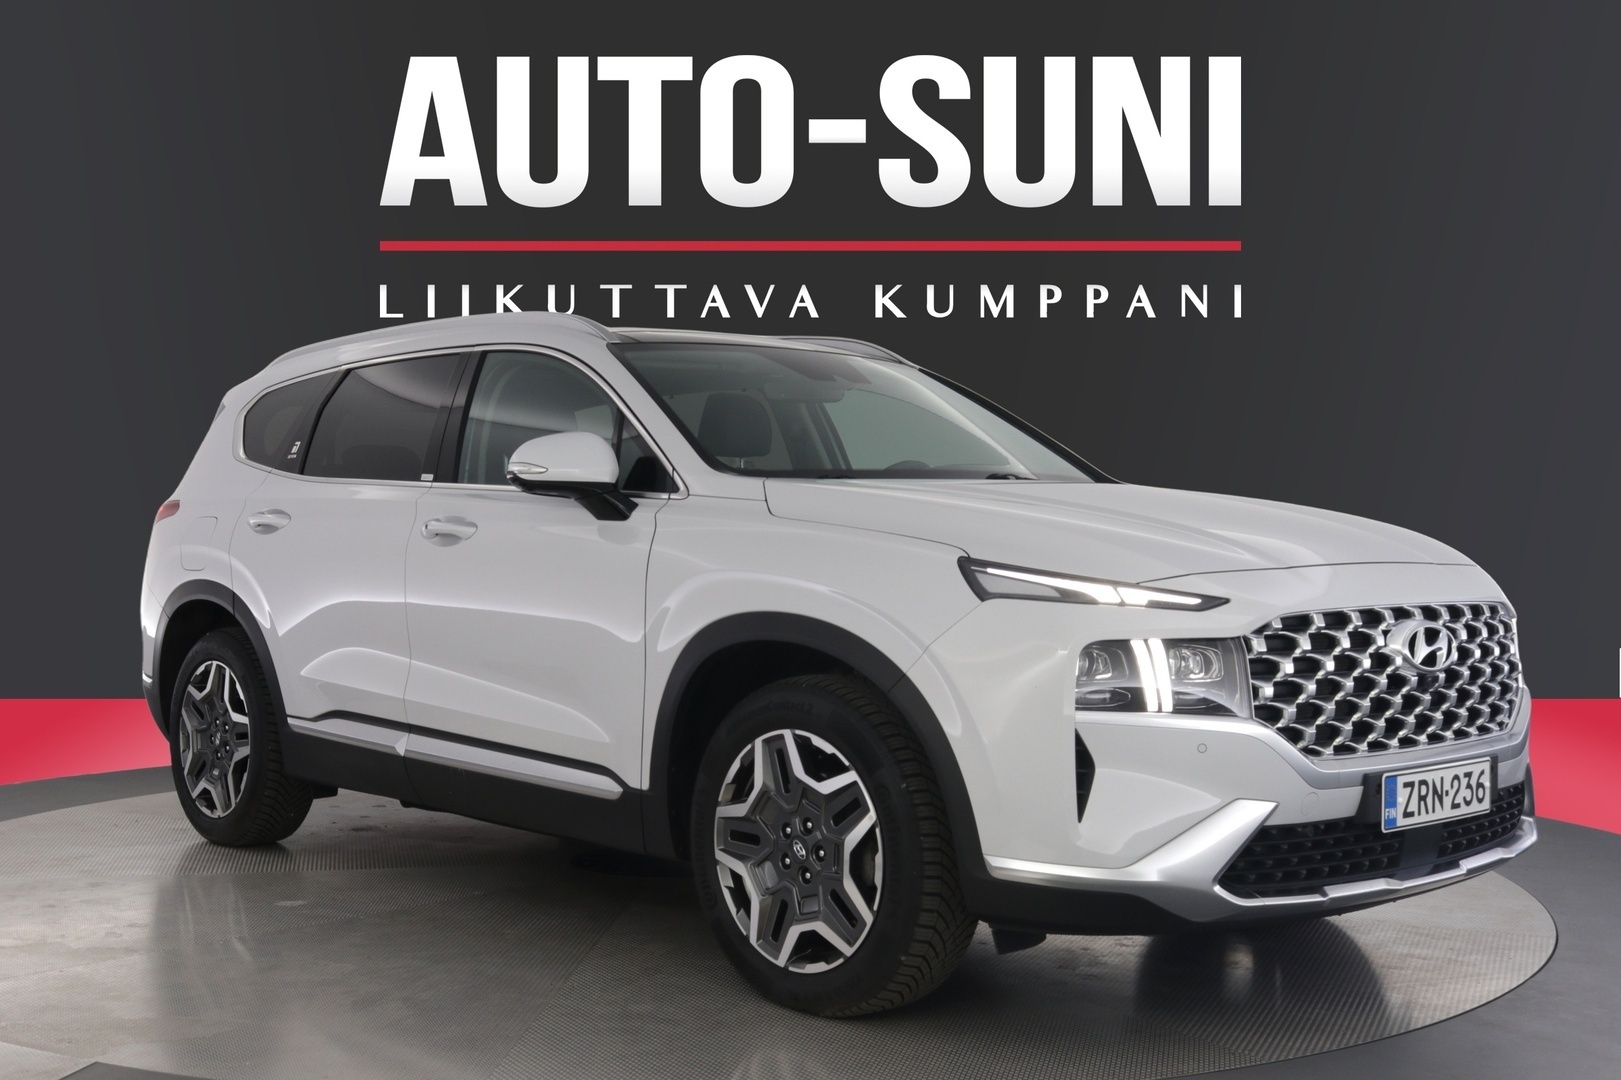
33,780 €
Auto-Suni, Lappeenranta, Etelä-Karjala
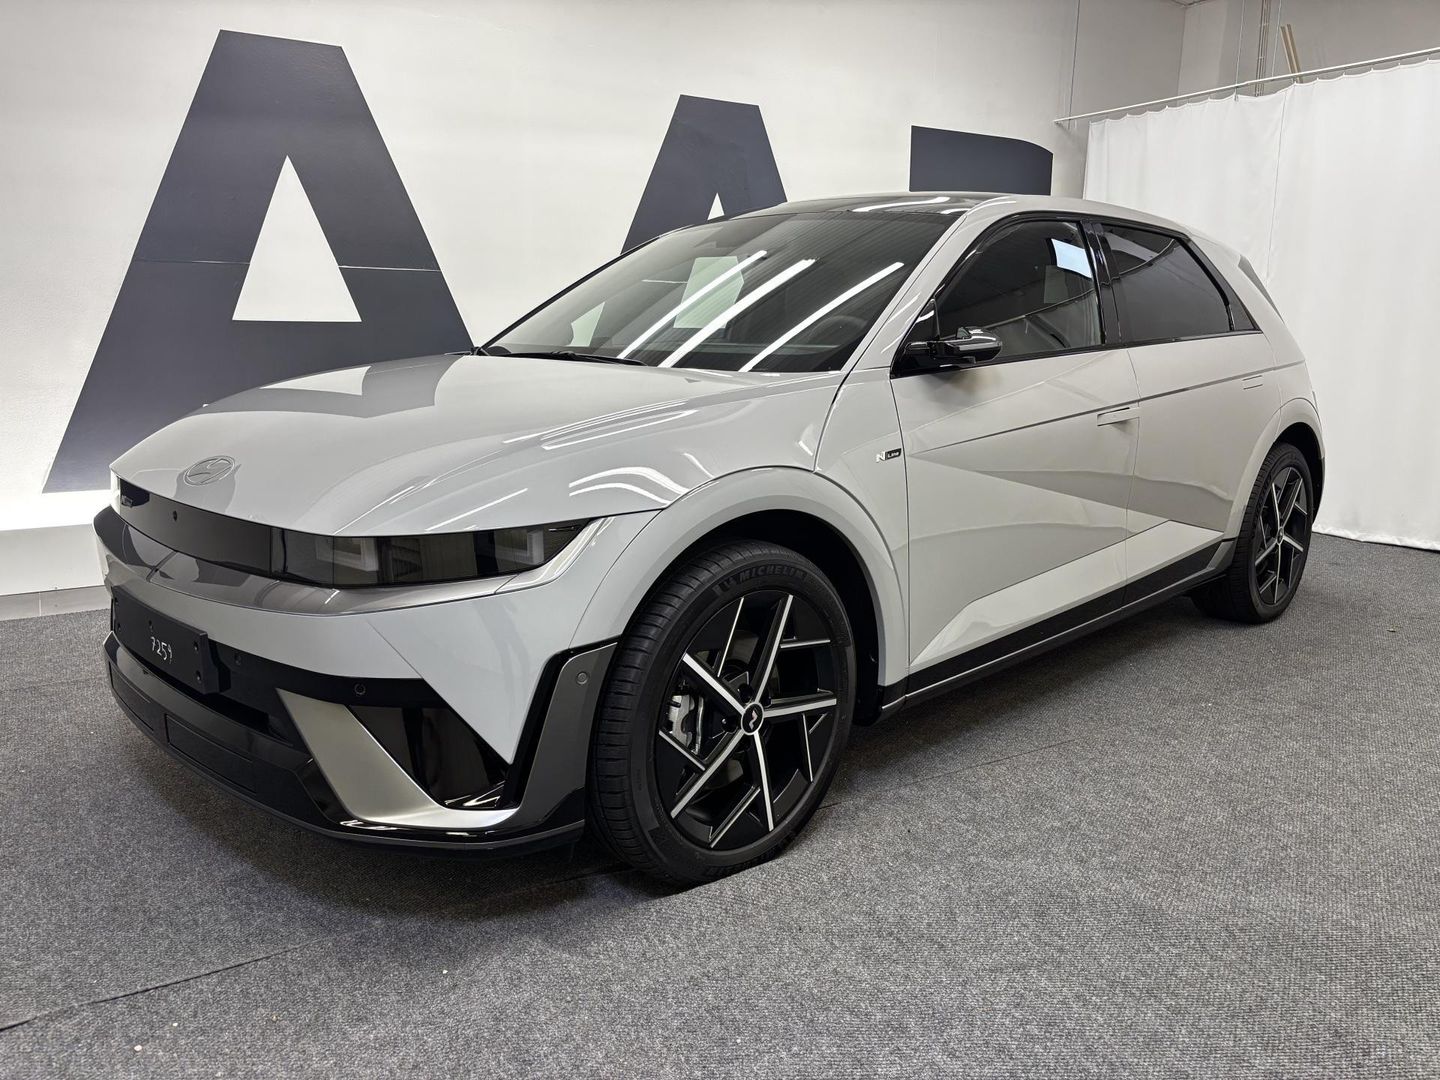
55,890 €
Automyynti Saarakkala Oy, Kurikka, Etelä-Pohjanmaa
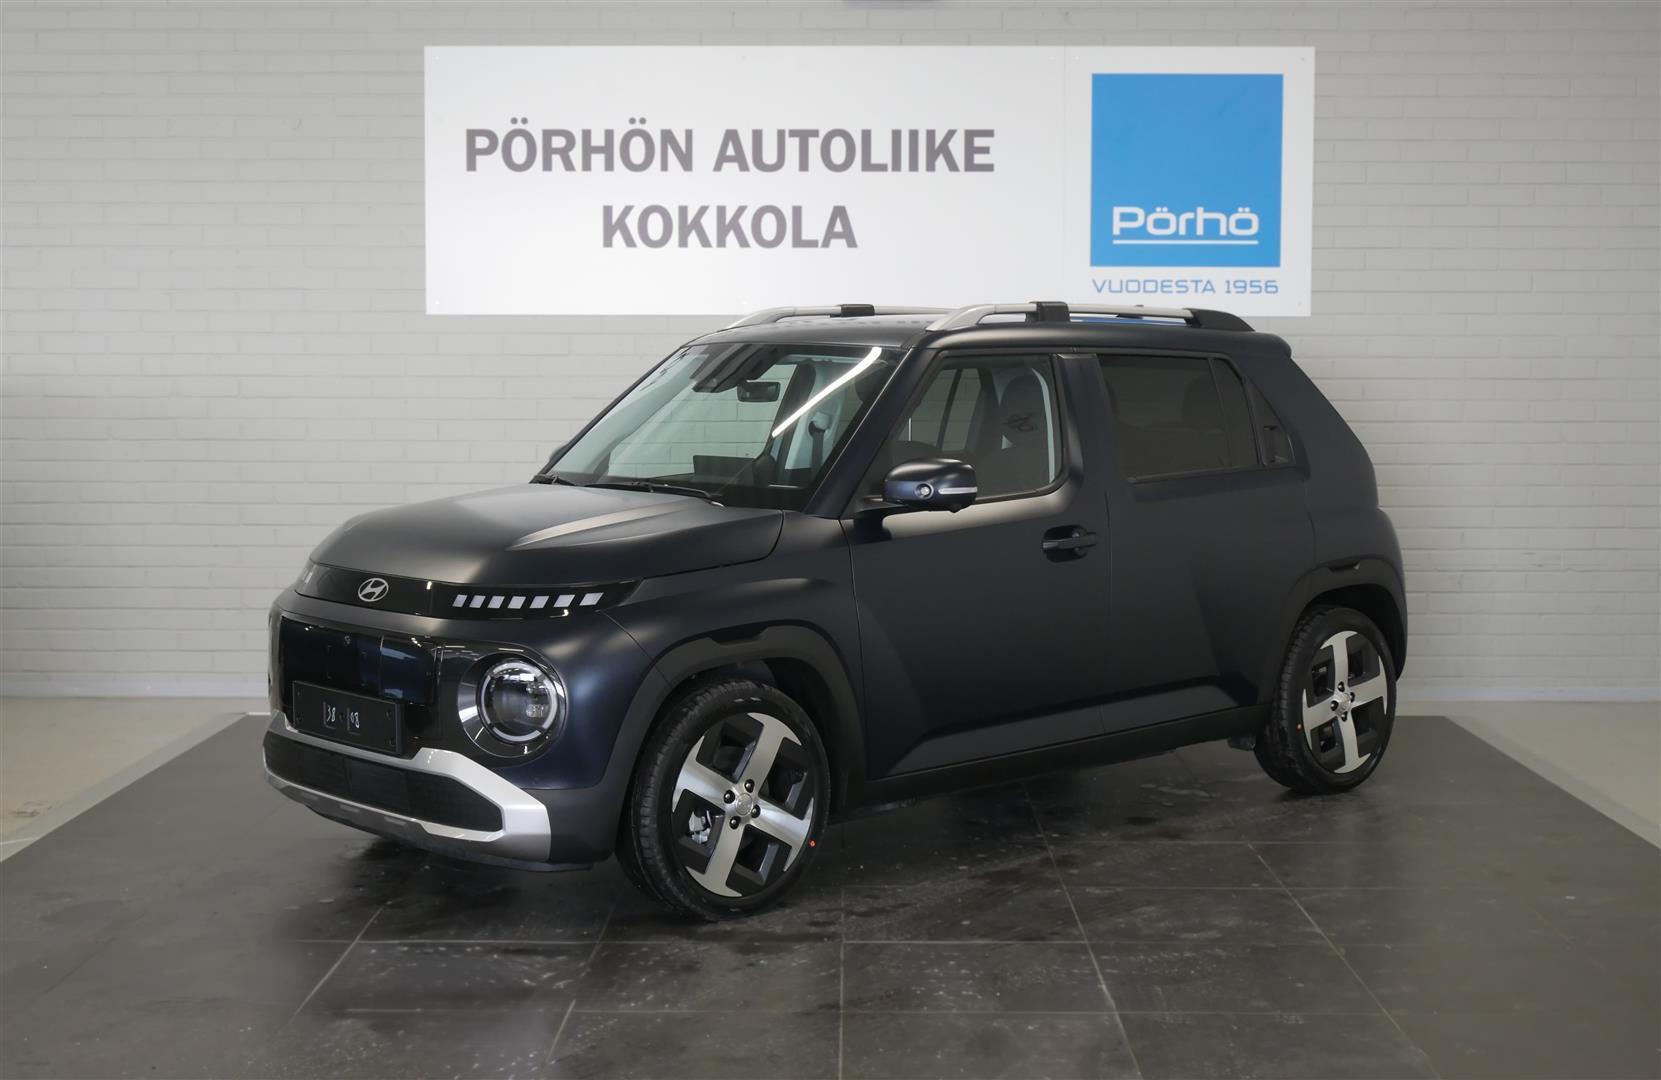
29,890 €
Pörhön Autoliike Kokkola, Keski-Pohjanmaa
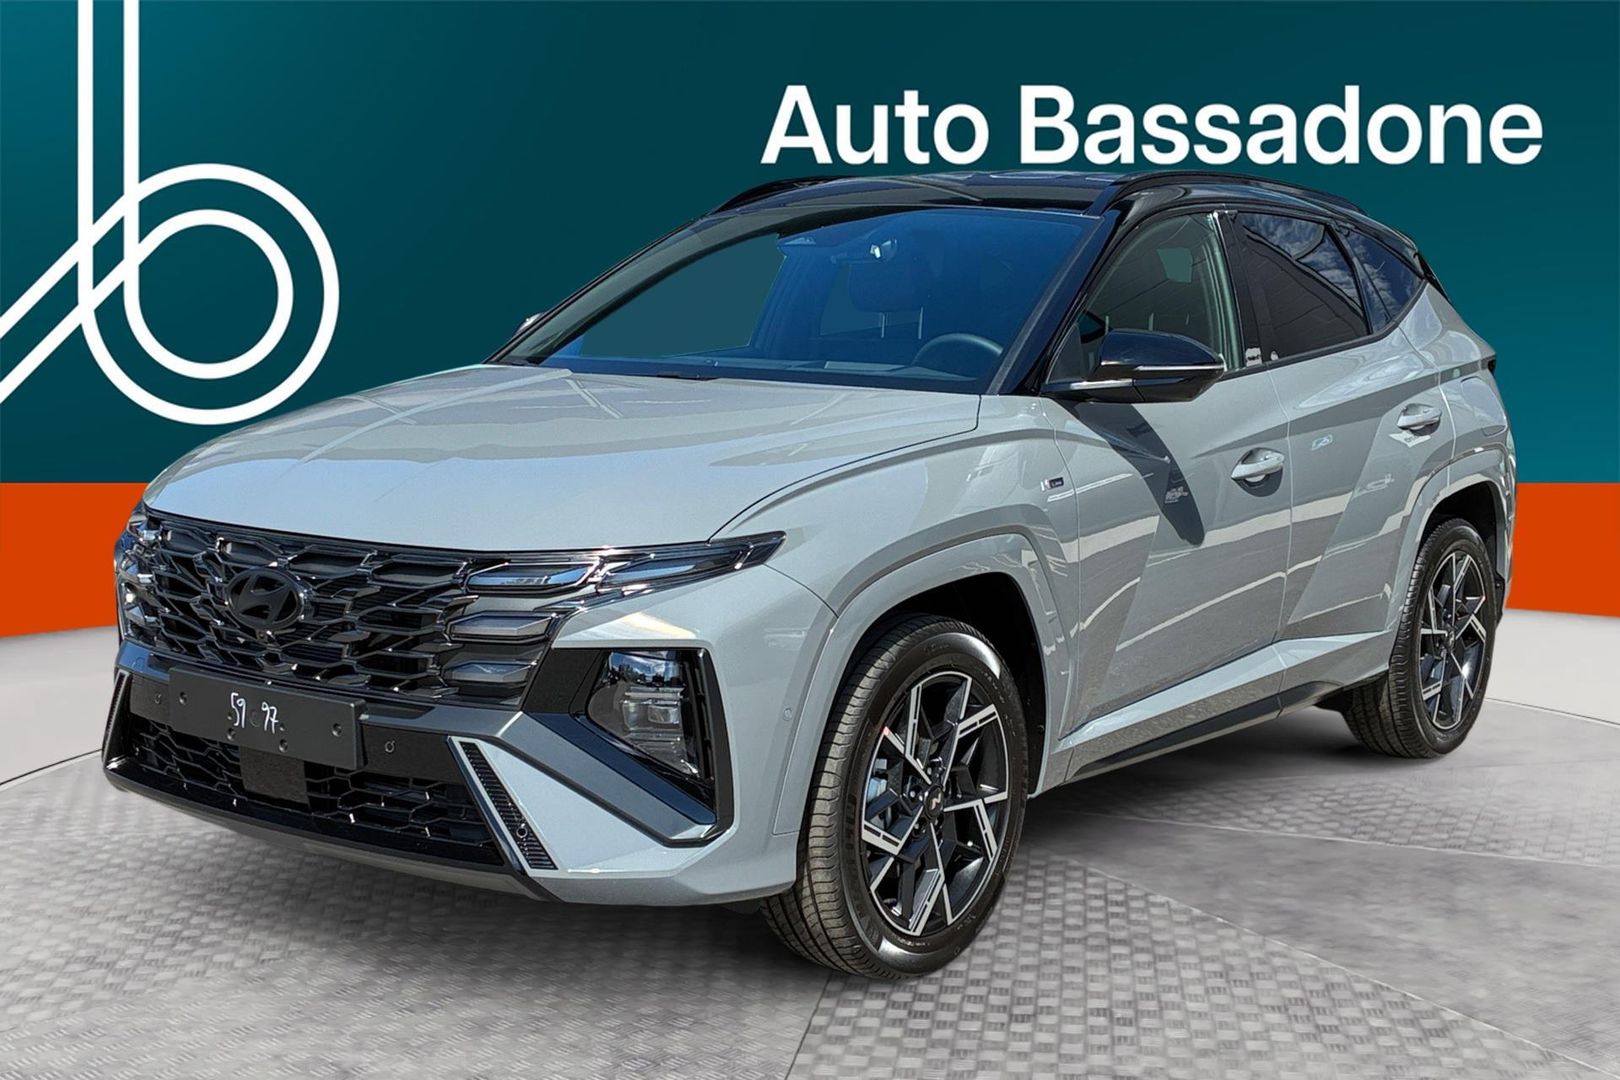
45,980 €
Auto Bassadone Turku, Varsinais-Suomi
Average failure rate 25.7 % (40,273 inspections in 2025, median mileage 138,000 km).
Ranked 9 of 27 brands by pass rate in 2025 periodic inspections.
Service and parking brake, brake dynamometer tests, stability control
Front and rear axles, springs and dampers, tyres and wheels
Steering joints and rods, steering gear
Exhaust measurement, OBD system, oil, fluid and fuel leaks
Frame, floor pan and sills, exhaust system, fuel tank
2025 periodic inspections recorded 18,522 defects leading to a failure across 40,273 inspections. The remaining 6 % of defects fall under other items. The single most common defect item was seisontajarrun dynamometritesti (2,751 failures).
Figures count defects, not cars: a failed car often has several defects. Shares are calculated from all defects leading to a failure.
Failure rates are not directly comparable between models because typical mileage differs.
| Model year | For sale | Asking price (median) |
|---|---|---|
| 2027 | 13 | 39,480 € |
| 2026 | 196 | 31,463 € |
| 2025 | 125 | 24,935 € |
| 2024 | 68 | 26,165 € |
| 2023 | 91 | 28,490 € |
| 2022 | 112 | 26,485 € |
| 2021 | 101 | 21,145 € |
| 2020 | 83 | 15,935 € |
| 2019 | 76 | 14,695 € |
| 2018 | 51 | 12,820 € |
| 2017 | 23 | 8,670 € |
| 2016 | 30 | 8,780 € |
| 2015 | 17 | 7,600 € |
| 2014 | 17 | 6,580 € |
| 2013 | 25 | 6,490 € |
| 2012 | 18 | 4,780 € |
| 2011 | 23 | 4,900 € |
| 2010 | 13 | 5,140 € |
| 2009 | 4 | 3,495 € |
| 2008 | 5 | 2,200 € |
| 2007 | 1 | 3,050 € |
| 2006 | 4 | 2,525 € |
| 2005 | 2 | 2,890 € |
Average depreciation 11.9 %/yr
Average effect on asking price according to the price estimate model, in cars that have the feature. The share is calculated from Hyundai cars with a price estimate. The vertical line on the bar and the avg figure show the same feature’s average effect across all models.
Time on market (median) 17 days
Private sellers have no Hyundai listings for sale right now. Figures are current listings by dealer chain.
| Region | For sale | Share | Median price |
|---|---|---|---|
| Uusimaa | 393 | 28.1 % | 17,970 € |
| Pirkanmaa | 179 | 12.8 % | 15,600 € |
| Varsinais-Suomi | 129 | 9.2 % | 16,900 € |
| Pohjois-Pohjanmaa | 73 | 5.2 % | 15,300 € |
| Kymenlaakso | 67 | 4.8 % | 23,900 € |
| Päijät-Häme | 66 | 4.7 % | 24,784 € |
| Etelä-Pohjanmaa | 60 | 4.3 % | 18,235 € |
| Pohjois-Savo | 58 | 4.2 % | 16,335 € |
| Etelä-Karjala | 56 | 4 % | 17,445 € |
| Satakunta | 54 | 3.9 % | 17,165 € |
| Keski-Suomi | 53 | 3.8 % | 17,490 € |
| Kanta-Häme | 50 | 3.6 % | 19,195 € |
| Etelä-Savo | 36 | 2.6 % | 20,895 € |
| Pohjois-Karjala | 36 | 2.6 % | 15,390 € |
| Lappi | 35 | 2.5 % | 28,933 € |
| Kainuu | 18 | 1.3 % | 17,700 € |
| Keski-Pohjanmaa | 17 | 1.2 % | 27,126 € |
| Pohjanmaa | 17 | 1.2 % | 7,900 € |
Tap a region on the map or in the table.
Situation on 30/09/2026, mainland Finland
There are 60,668 Hyundai passenger cars in traffic use in Finland, 2.2 % of the whole passenger car fleet.
The most common year of first use is 2021, with 4,620 cars in traffic use. The first bar covers all cars first used in 1994 or earlier.
The figures exclude passenger cars in the separate Åland register.
2,572 cars, 2.1 % of all used imports
For sale 1,401
There are 1,098 used Hyundai cars for sale in Finland. bilbil.fi lists all used Hyundai cars with prices and price estimates; the largest sellers are Kamux, Auto Bassadone, Saka.
The median asking price of Hyundai cars for sale is 18,400 €, and the average is 20,718 €. Prices range from 20 € to 87,045 €.
We don't maintain a new-car price list, but you can see used Hyundai price levels by model. The median asking price is 18,400 €, and the cheapest start from 20 €.
The cheapest model is i40, with a median asking price of 6,490 €. The priciest is Ioniq 9 (76,840 €).
The most popular model is i20 (198 cars for sale). The next most popular are i30 and Tucson.
Hyundai is Finland's #12 most popular make: its share of all cars for sale is 1.8 %.
Based on median asking prices by model year, a used Hyundai's value falls by an average of 11.9% per year.
The failure rate of Hyundai cars in 2025 periodic inspections was 25.7 % on average (40,273 inspections). Hyundai ranks 9 of 27 brands by pass rate. The national average was 26.9 %. Failure rates are not directly comparable because typical mileage differs.
There are 324 fully electric Hyundai cars and 114 plug-in hybrids for sale.
Sold Hyundai cars were listed for a median of 17 days before being sold.
The most common fuel type is petrol: 49% of Hyundai cars for sale.
68% of Hyundai cars for sale have an automatic gearbox.
90% of Hyundai cars for sale are dealer listings and 10% are from private sellers.
The most common body type is hatchback: 41% of cars for sale.
The average mileage of Hyundai cars for sale is 99,179 km.
The largest number of Hyundai cars for sale is in Uusimaa (393 cars). The next largest regions are Pirkanmaa and Varsinais-Suomi.
| Accent | 1 | 18 | 2,575 € | 1,250–4,900 € | 12 days | – | 346 | 2006 | 185,500 km | Sedan |
|---|---|---|---|---|---|---|---|---|---|---|
| Coupe | 0 | 46 | 4,200 € | 2,500–6,000 € | 16 days | – | 264 | 2005 | 232,065 km | Coupé |
| Elantra | 1 | 19 | 1,650 € | 1,330–4,900 € | 13 days | – | 221 | 2006 | 253,041 km | Sedan |
| Galloper | 0 | 1 | – | – | 7 days | – | 17 | – | – | – |
| Genesis Coupe | 1 | 1 | 13,790 € | 13,790–13,790 € | 17 days | – | 16 | 2011 | 166,400 km | Coupé |
| Getz | 3 | 175 | 2,295 € | 700–4,900 € | 7 days | – | 3,688 | 2007 | 171,560 km | Hatchback |
| H1 Van | 0 | 11 | 7,900 € | 7,900–7,900 € | 16 days | – | – | 2005 | 267,000 km | Other |
| i10 | 28 | 103 | 11,730 € | 4,499–17,990 € | 20 days | 2.2 % | 1,254 | 2023 | 56,853 km | Hatchback |
| i20 | 198 | 731 | 13,785 € | 1,700–26,500 € | 15 days | 1.3 % | 14,580 | 2021 | 78,226 km | Hatchback |
| i30 | 172 | 748 | 12,490 € | 20–36,870 € | 17 days | – | 355 | 2018 | 135,563 km | Estate |
| i30 Fastback | 9 | 28 | 15,990 € | 6,890–25,990 € | 23 days | – | – | 2019 | 121,111 km | Hatchback |
| i40 | 27 | 150 | 6,490 € | 260–15,900 € | 16 days | 1.3 % | 2,082 | 2013 | 232,418 km | Estate |
| Ioniq | 1 | 1 | 14,880 € | 14,880–14,880 € | 3 days | 6.6 % | 3,586 | 2020 | 104,000 km | Hatchback |
| Ioniq 5 | 114 | 415 | 34,900 € | 22,490–61,195 € | 17 days | – | 5 | 2023 | 49,039 km | SUV |
| Ioniq Electric | 13 | 79 | 15,335 € | 13,899–19,900 € | 11 days | – | – | 2020 | 91,903 km | Hatchback |
| Ioniq Plug-In | 27 | 82 | 15,815 € | 12,790–22,800 € | 16 days | – | – | 2020 | 91,853 km | Hatchback |
| ix20 | 2 | 40 | 4,385 € | 1,300–6,899 € | 16 days | – | 820 | 2012 | 229,498 km | MPV |
| ix35 | 15 | 89 | 6,600 € | 3,999–10,400 € | 18 days | 1 % | 1,453 | 2012 | 222,738 km | SUV |
| ix55 | 1 | 3 | 9,240 € | 8,490–9,990 € | 28 days | – | 2 | 2010 | 220,750 km | MPV |
| Kona | 88 | 358 | 20,195 € | 9,400–42,990 € | 13 days | 2.1 % | 5,141 | 2021 | 84,760 km | SUV |
| Kona Electric | 21 | 63 | 39,915 € | 19,980–49,360 € | 27 days | – | – | 2026 | 18,674 km | SUV |
| Matrix | 1 | 17 | 2,875 € | 1,900–3,850 € | 5 days | – | 316 | 2006 | 153,390 km | SUV |
| Santa Fe | 44 | 132 | 30,635 € | 1,690–69,990 € | 20 days | 3 % | 1,466 | 2021 | 150,298 km | SUV |
| Scoupe | 0 | 1 | – | – | 24 days | – | – | – | – | – |
| Sonata | 1 | 91 | 2,450 € | 1,666–5,900 € | 13 days | – | 942 | 2007 | 284,956 km | Sedan |
| Terracan | 0 | 9 | 5,490 € | 3,650–6,490 € | 20 days | – | 70 | 2004 | 299,043 km | SUV |
| Trajet | 0 | 13 | – | – | 19 days | – | 144 | – | – | – |
| Tucson | 134 | 327 | 24,375 € | 2,690–57,579 € | 21 days | 3 % | 4,485 | 2021 | 107,709 km | SUV |
| Veloster | 1 | 2 | 5,740 € | 5,500–5,980 € | 18 days | – | 49 | 2012 | 241,625 km | Hatchback |
| Bayon | 19 | 33 | 16,990 € | 8,990–28,880 € | 51 days | 6.2 % | 884 | 2023 | 69,564 km | Hatchback |
| Bayon Cross | 36 | 28 | 26,900 € | 18,900–29,990 € | 26 days | – | – | 2026 | 3,999 km | Hatchback |
| Grandeur | 1 | 1 | 24,490 € | 24,490–24,490 € | 26 days | – | 3 | 2017 | 92,000 km | Sedan |
| H-1 | 2 | 37 | 4,990 € | 900–14,500 € | 20 days | – | 562 | 2007 | 225,072 km | MPV |
| i20 5d | 0 | 2 | – | – | 2 days | – | – | – | – | – |
| i20 Active | 2 | 6 | 11,235 € | 8,980–13,490 € | 12 days | – | 647 | 2018 | 97,000 km | Hatchback |
| i20N | 3 | 9 | 26,845 € | 22,000–29,990 € | 28 days | – | – | 2022 | 53,250 km | Hatchback |
| Inster | 46 | 44 | 29,795 € | 23,900–34,600 € | 46 days | – | 435 | 2026 | 1,854 km | Hatchback |
| IONIQ 1,6 HYBRID 6-DCT STYLE MY20 | 1 | 0 | 4,999 € | 4,999–4,999 € | – | – | – | 2021 | 328,400 km | – |
| Ioniq 3 | 22 | 1 | 37,900 € | 36,490–40,958 € | 1 days | – | – | 2026 | 914 km | Hatchback |
| Ioniq 6 | 40 | 121 | 47,030 € | 28,490–58,998 € | 39 days | – | – | 2026 | 21,220 km | Sedan |
| Ioniq 9 | 9 | 19 | 76,840 € | 69,770–87,045 € | 54 days | – | 27 | 2026 | 5,026 km | SUV |
| Ioniq Hybrid | 13 | 56 | 16,390 € | 9,990–18,480 € | 14 days | – | – | 2020 | 115,538 km | Hatchback |
| KONA Hybrid | 1 | 9 | 27,880 € | 27,880–27,880 € | 14 days | – | – | 2023 | 24,000 km | SUV |
| NEXO | 0 | 0 | 9,990 € | 9,990–9,990 € | – | – | – | 2019 | 130,000 km | SUV |
| Santa Fe Plug-in | 0 | 2 | – | – | 11 days | – | – | – | – | – |
| Sante Fe Plug-in | 0 | 1 | – | – | 27 days | – | – | – | – | – |
| XG30 | 0 | 1 | – | – | 15 days | – | – | – | – | – |